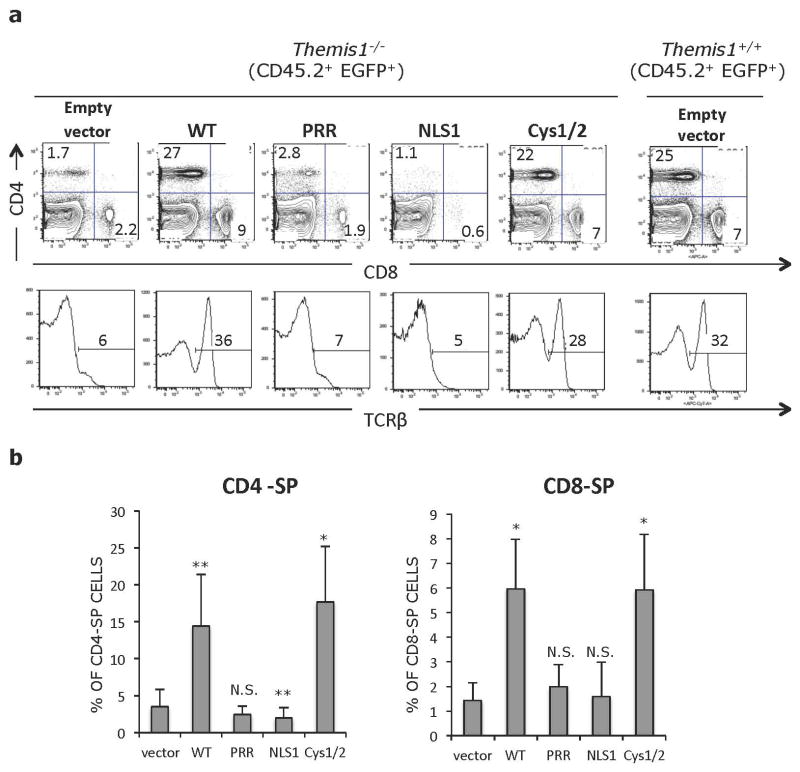
Figure 4.
a. Representative flow cytometry analysis of CD45.2+ EGFP+ splenocytes from bone marrow chimeras shown in Figure 2. Upper plots show CD4 versus CD8 profiles, lower histograms show percent of TCRβ+ T cells within the CD45.2+ EGFP+ population. Plots in right column show Themis1+/+ splenocytes infected with empty retroviral vector for reference. b. Percentage of CD45.2+ EGFP+ CD4-SP and CD8-SP splenocytes in the indicated bone marrow chimeras (n=6 each). *p ≤0.05, **p ≤0.01, N.S., not significant (Two-tailed T-test, unequal variance). All comparisons are to vector only.

