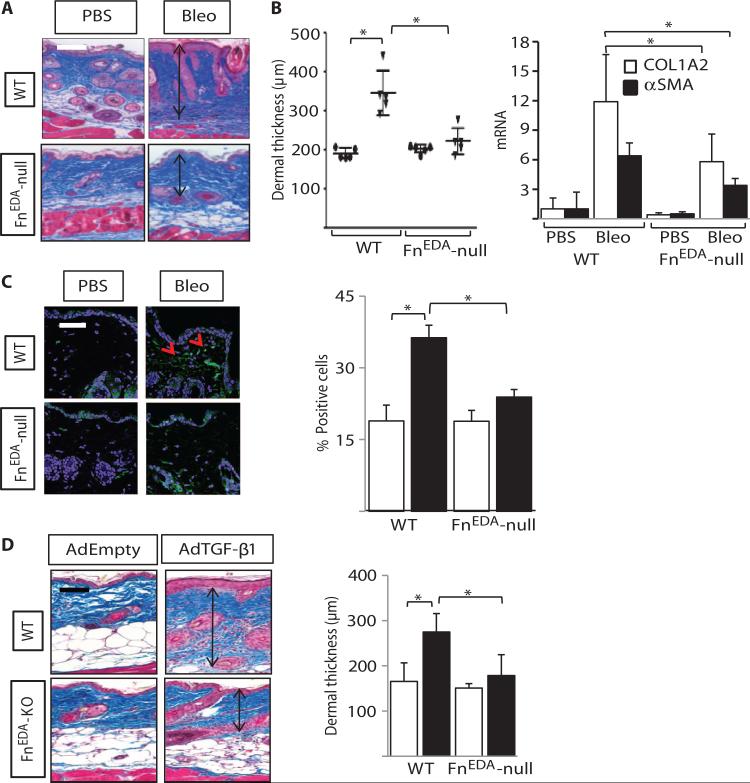
Fig. 2. Skin fibrosis is attenuated in mice lacking FnEDA.
FnEDA-null mice and wild-type (WT) mice in parallel received daily subcutaneous injections of phosphate-buffered saline (PBS) or bleomycin (Bleo) for 14 days and sacrificed at day 24 (A to C), or two subcutaneous injections of AdTGF-β1 or empty vector 14 days apart and sacrificed at 28 days (D). Lesional skin was harvested for analysis. (A) Left panel: Masson's trichrome stain. Representative images. Arrows indicate dermis. Scale bar, 100 μm. Right panel: Dermal thickness (distance from dermal-epidermal junction to adipose layer), shown as the means ± SD of triplicate determinations per hpf from five mice per group. Ovals, PBS; inverted triangles, bleomycin. *P < 0.0001, PBS versus bleomycin; P < 0.001, WT versus FnEDA-null bleomycin, one-way ANOVA followed by Bonferroni's multiple comparison test. (B) mRNA levels were determined by real-time quantitative PCR. The results, normalized with GAPDH, represent the means ± SD of triplicate determinations from four mice per group. *P = 0.014, Mann-Whitney U test. (C) Immunofluorescence using antibodies against αSMA (green) and 4′,6′-diamidino-2-phenylindole (DAPI) (blue). Left panel: Representative images. Scale bar, 50 μm. Red arrows indicate αSMA-positive cells in the dermis. Right panel: The proportion of αSMA-immunopositive cells in the lesional dermis was determined in five randomly selected hpf per slide from four mice per group. Open bars, PBS; closed bars, bleomycin. PBS versus bleomycin. *P < 0.0001, WT bleomycin versus null bleomycin; P < 0.001, one-way ANOVA followed by Bonferroni's multiple comparison test. (D) Masson's trichrome stain. Left panel: Representative images. Scale bar, 100 μm. Right panel: Dermal thickness, shown as the means ± SD of triplicate determinations per hpf from four mice per group. Open bars, PBS; closed bars, AdTGF-β1. *P = 0.02, PBS versus bleomycin; P = 0.03, WT versus FnEDA-null bleomycin, Sidak's multiple comparison test.

