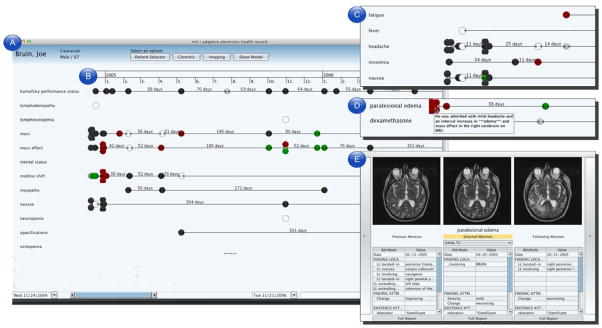
Fig. 3.

Screen capture of the AdaptEHR patient dashboard. (a) The findings list serves as the primary method of navigating the patient record. (b) The timeline summarizes each observation of a finding across time, color-coded by trends such as improving (green), worsening (red), unchanged (gray), and not present (black). (c) Findings are filtered using information encoded in knowledge sources; in this inset, only findings related to “sign or symptom” are shown. (d) In this inset, only findings related to dexamethasone such as edema (to see whether the drug has an effect on reducing swelling) and cushingoid (a possible side effect of the drug). (e) Selecting a particular observation brings up details on demand such as related imaging studies and attributes extracted from the text.
