
Figure 1. Graphene oxide (GO) grades.
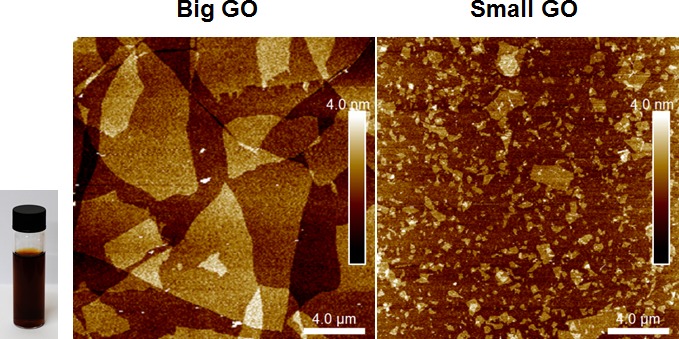
Left and Right panels show atomic force microscopy images of graphene oxide on a silicon dioxide substrate indicating the flake size distribution and monolayer thickness of the flakes. Inset shows a vial of b-GO stock dispersion in DMSO and water, at concentration of 2.3 mg/ml.