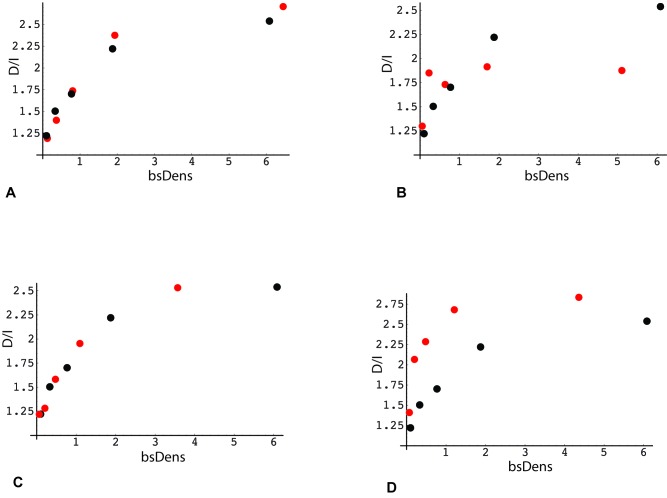
Figure 6. Association of the direction of gene expression change with bisulfite peak density and methylation levels in RRBS data (analysis 1).
X-axis: Median RRBS locus density in each quintile. Bisulfite densities (bsDens) were calculated as: 100 * (number of bisulfite loci within the gene *36)/gene length in bp. Y-axis: Ratio (number of genes with decreased expression in poor responders: number of genes with increased expression) Black points (panels A – D): plot derived from RRBS reference gene set (same as Figure 5, panel A; n = 15203). (A) Red points: gene subset with average intragenic methylation level of RRBS loci < 0.5. (B) Red points: subset with average intragenic methylation level of RRBS loci > 0.5. (C) Red points: gene subset with RRBS loci localized within 5ʹ-end quartile of gene length, i.e., distance from TSS to the most 3ʹ-proximal locus less than 25% of total gene length. (D) Red points: subset with RRBS loci localized within 5ʹ-end quartile of gene length, i.e., distance from TSS to the most 5ʹ-proximal locus greater than 75% of total gene length.

