
Figure 3. Changes in the ultrastructure of autophagic structures in HEI-OC1 cells treated with H2O2 briefly.
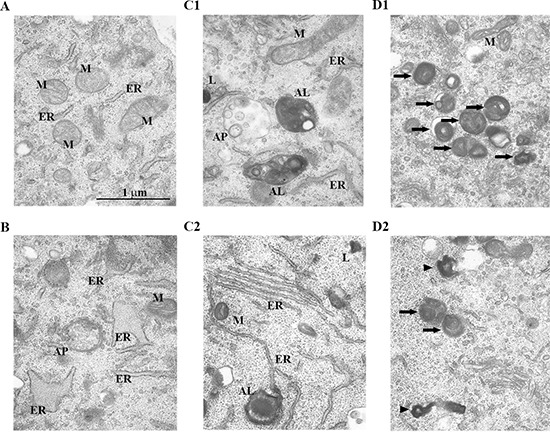
Representative transmission electron microscopy (TEM) photomicrographs of HEI-OC1 cells. Cells were treated as in cell viability and population doubling experiments (Methods). (A) Control cell. (B–D) Cells 6 h (B), 24 h (C1, C2), and 48 h (D1, D2) after treatment with 5 mM H2O2 for 1 h. AP, autophagosome; AL, autolysosome; M, mitochondria; ER, endoplasmic reticulum; L, lysosome. The arrowheads and arrows point to lipofuscin and aggregates, respectively.