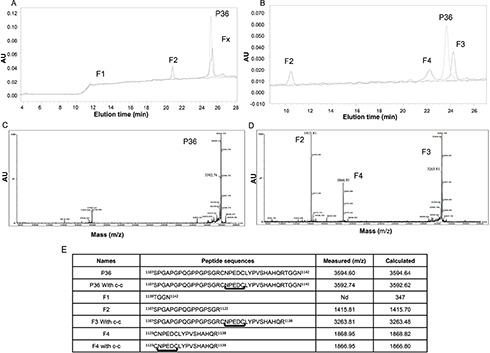
Figure 1. HPLC separation of plasmin degradation products.

(A) P36 peptide was submitted to plasmin digestion at 37°C (E:S = 1:50). The digestion products were separated by HPLC on a Waters analyzer (C18 reverse-phase column) by method 1. Three main peaks were separated (F1, F2 and Fx). The non-digested peptide P36 peptide is shown in dotted line. (B) By using method 2, the Fx peak was further fractionated and provided two peaks, F3 and F4. The non-digested peptide P36 is shown in dotted line. (C and D) MALDI-ToF MS characterization of the peptides released by plasmin digestion. (C) The intact P36 peptide analysis revealed a 3592.74 Da major peak, which matched the expected P36 peptide molecular weight. (D) After incubation of P36 peptide with plasmin, the plasmin digestion products consisted of 3 major peaks (F2, F3 and F4) of 1415.81 Da, 3263.81 Da and 1866.95 Da respectively. The F2 1415.81 Da peak matched the expected mass of the SPGAPGPQGPPGPSGR Col1 domain of P36 peptide, while the F4 1866.95 Da peak matched the expected CNPEDCLYPVSHAHQR major part of the NC1(XIX) domain of P36 peptide. The F3 3263.81 peak matched the expected entire P36 peptide sequence without the four C-terminal residues (TGGN). (E) Plasmin cleavage products of the collagen XIX derived-P36 peptide.
