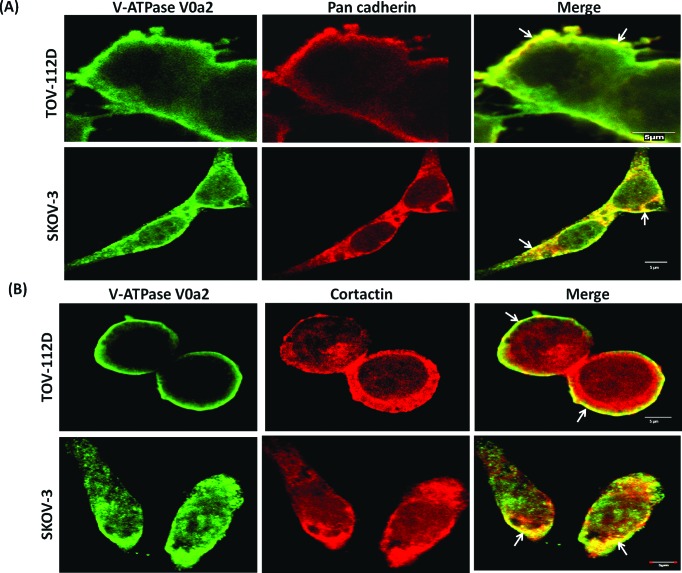
Figure 3. V-ATPase-V0a2 isoform exhibits association with invasion associated proteins on ovarian cancer cell surface.
Confocal imaging of (A) V-ATPase-V0a2 (in green) and pan cadherin (in red) for plasma membrane staining in TOV-112D and SKOV-3 ovarian carcinoma cells. Merged images (yellow regions, shown with arrow) show the co-localization of V-ATPase-V0a2 with pan cadherin. (B) Representative image showing expression of V-ATPase-V0a2 (in green) and cortactin (in red) in TOV-112D and SKOV-3 ovarian carcinoma cells. Merged images (yellow regions, shown with arrow) indicate the co-association of V0a2 in some regions of the plasma membrane with cortactin, a component of the cellular invasion apparatus at the leading edge. Original maginification-× 600; scale bars; 5 μm. No V0a2 co-association with cortactin could be observed intracellularly. Images were acquired using the Fluoview FV10i confocal laser-scanning microscope (Olympus). Olympus Fluoview software version 4.1 (Olympus) was used to capture and analyze the images. Representative images from four independent experiments are shown.

