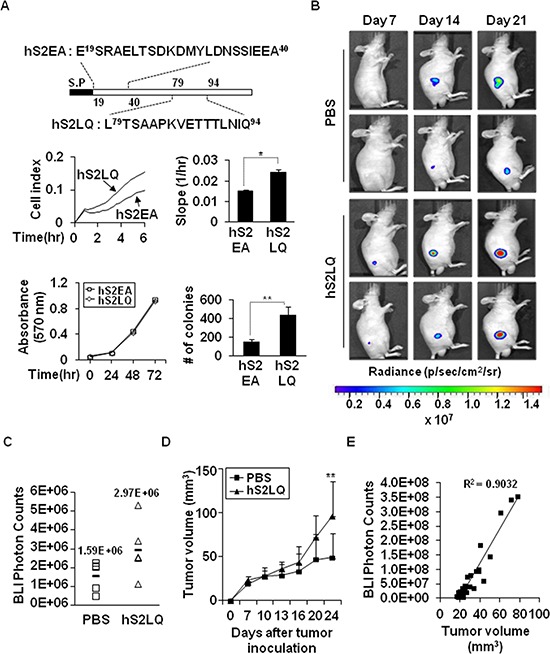
Figure 3. The syndecan-2 synthetic peptide significantly increases subcutaneous tumor growths in vivo.

(A) Schematic diagram depicting the synthetic peptides of human syndecan-2. Peptides corresponding to human syndecan-2 extracellular domain regions consisting of residues 79–94 (hS2LQ: LTSAAPKVETTTLNIQ) and residues 19–40 (hS2EA: ESRAELTSDKDMYLDNSSIEEA) were synthesized (top). HCT116 cells were mixed with synthetic peptides (final 5 nM). Cells migration was analyzed using the provided RTCA software (middle). n = 5; *p < 0.05. Cell viability was determined by MTT assay (bottom left). Colony formation was analyzed as described above (bottom right). N-terminal human syndecan-2 synthetic peptide (hS2EA) was used as a control peptide. n = 4; **p < 0.01. (B) HT29-luc cells (5 × 10⁶ cells/mouse) preincubated with synthetic peptides were injected subcutaneously into the right flanks of BALB/c nude mice (n = 5/group). Representative images of in vivo tumor development at the injection sites, which received HT29-luc cells incubated with human syndecan-2 synthetic peptide or PBS from the same mouse and taken weekly after implantation, are shown. (C) Tumor growth was quantified (as photon/s) weekly by IVIS at 7 days after injection. PBS, mean = 1.59E+06 photon/s, 95% CI = 1.35E+06 to 1.83E+06 photon/s; hS2LQ, mean = 2.97E+06 photon/s, 95% CI = 2.50E+06 to 3.44E+06 photon/s; p < 0.05. (D) Tumor volume (mm3) represented as average at 3–4 days. Average tumor volumes for 21 days were 42.75 mm3 with syndecan-2 peptide, 95% CI = 34.52 mm3 to 51.00 mm3 than the 29.21 mm3 with PBS, 95% CI = 24.94 mm3 to 33.48 mm3. **p < 0.01. (E) Correlation between tumor volume measurement and photon imaging (R2 = 0.9032).
