
Figure 4. The syndecan-2 synthetic peptide significantly increases the metastasis in mouse models.
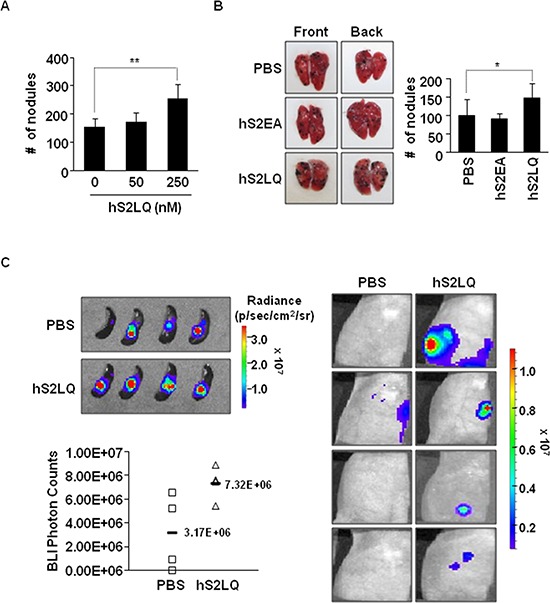
(A) BALB/c mice (n = 5/group) were injected with B16F10 melanoma cells (1 × 10⁵ cells/mice) incubated with the synthetic peptides into the tail vein. Mice were sacrificed after 2 weeks, and the number of metastatic tumor nodules was counted in the lungs. The bar graph indicates the numbers of metastatic lung nodules. The columns represent the mean ± s.d. of number of lung metastatic nodules, **p < 0.01. (B) B16F10 melanoma cells incubated with the indicated peptide (final 250 nM) were injected into BALB/c mice (n = 7/group) via the tail vein. Representative photographs of the front and back sides of each lung are shown. The columns represent the mean ± s.d. of number of lung metastatic nodules, *p < 0.05. (C) Mouse mammary cancer 4T1-luc cells (1 × 10⁵ cells/mice) were incubated with syndecan-2 synthetic peptide (final 250 nM) or PBS, and injected into spleens of BALB/c mice. Bioluminescence images of spleen (left, top; PBS, mean = 3.17E+06 photon/s, 95% CI = 2.10E+06 to 4.24E+06 photon/s; syndecan-2 peptide, mean = 7.32E+06 photon/s, 95% CI = 2.57E+06 to 12.07E+06 photon/s, p < 0.05) and liver (right) metastatic 4T1-luc cells, taken after 7 days of splenic injection, are shown. The respective photon counts of each mouse are represented by the color scales beside the mouse pictures. The IVIS imaging system acquired pictures were taken 10–20 min after intraperitoneal injection of d-luciferin (150 mg/kg). Quantification of tumor signal is represented as photon counts (left, bottom).