
Figure 5. Mechanism by which miR-23a suppresses migration and invasion of prostate cancer cells.
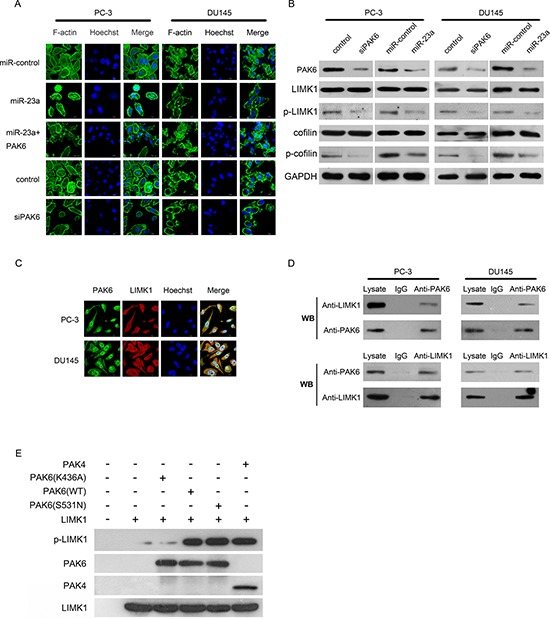
(A) Ectopic expression of miR-23a or of si-PAK6 disrupted stress fiber network. Stress fibers and actin filaments were visualized by phalloidin staining (green). Scale bar: 10 μm. (B) Immunoblotting of PAK6, LIMK1, phosphorylated LIMK1 (p-LIMK1), cofilin and phosphorylated cofilin (p-cofilin) in PC-3 and DU145 cells infected respectively with si-PAK6, si-control, miR-control-lentivirus or miR-23a-lentivirus. (C) Immunofluorescent staining for PAK6 (green) and p-LIMK1 (red) in PC-3 cells (upper panels) or in DU145 cells (lower panels). Nuclei were counterstained with Hoechst33258 (blue). The right side illustrates merged images of PAK6, phosphorylated LIMK1 (p-LIMK1), and Hoechst staining. Scale bar: 10 μm. (D) PC-3 cell lysates were immunoprecipitated with PAK6 antibody and subjected to Western blotting to ascertain LIMK1 and PAK6 expression using indicated antibodies (upper panels). PC-3 cell lysates were immunoprecipitated with LIMK1 antibody and subjected to Western blotting using indicated antibodies (lower panels). (E) In vitro kinase assay was performed using purified PAK6 (K436A), PAK6 (S531N), PAK6 (WT), PAK4 and LIMK1 protein. Phosphorylated LIMK1 (p-LIMK1), PAK6, PAK4 and LIMK1 were measured by Western blotting.