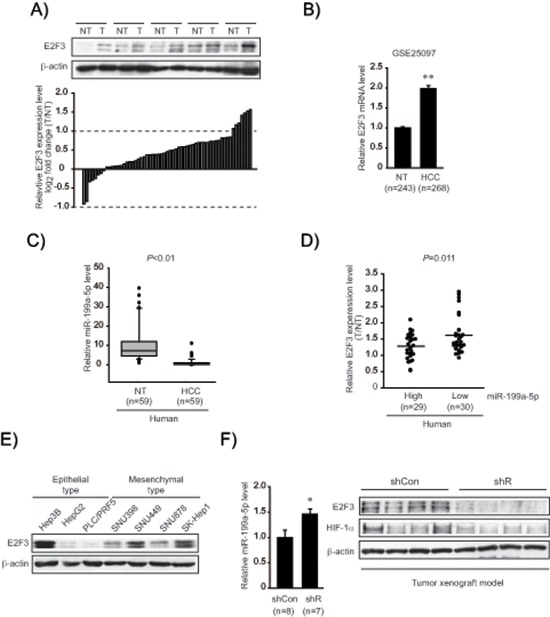
Figure 4. Identification of E2F3 as a novel target of miR-199a-5p.

(A) E2F3 protein levels in human HCC specimens. Immunoblottings for E2F3 were done on 59 pairs of primary HCCs (T) and their adjacent non-tumor liver tissues (NT). A log2 fold change more than 1 or less than −1 was considered overexpression or suppression. Equal loading of proteins was confirmed by immunoblottings for β-actin. (B) Relative E2F3 mRNA levels in a large cohort of HCC GEO database. Data represents the mean ± S.E. (significantly different from NT, **P < 0.01). (C) Relative miR-199a-5p levels in human HCC specimens (n = 59, in each group). (D) Inverse relationship between E2F3 expression and miR-199a-5p levels in HCC and adjacent non-tumor tissues. The levels of E2F3 were separated into miR-199a-5p high and low expression by the median value. Symbols represent individual samples. (E) Immunoblottings for E2F3 in epithelial and mesenchymal liver tumor cell lines. (F) Relative miR-199a-5p and E2F3 protein levels in mesenchymal tumor xenografts. The tumors formed in each group at 10 weeks, miR-199a-5p levels were measured using qRT-PCR assays (left). The data represent the mean ± S.E. (significantly different from shCon, *P < 0.05). Representative immunoblottings for E2F3 and HIF-1α are shown (right). shR represents Gα12-depletion using a shRNA approach in a SK-Hep1-xenograft model.
