
Figure 1. Expression of heregulin and HER3 in claudin-low, luminal and basal A breast cancer cell lines.
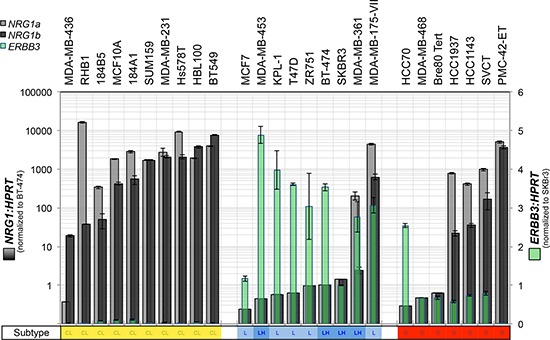
The breast cancer cell lines indicated were cultured to sub-confluence then total RNA was isolated for quantitative RT-PCR analysis of heregulin (neuregulin-1 α and β splice isoforms: NRG1α and NRG1β) and ERBB3. Data shown are means ± standard deviation. We observed an inverse association between ERBB3 and NRG1 with reciprocal expression in luminal compared to claudin-low (basal B) breast cancer cell lines.