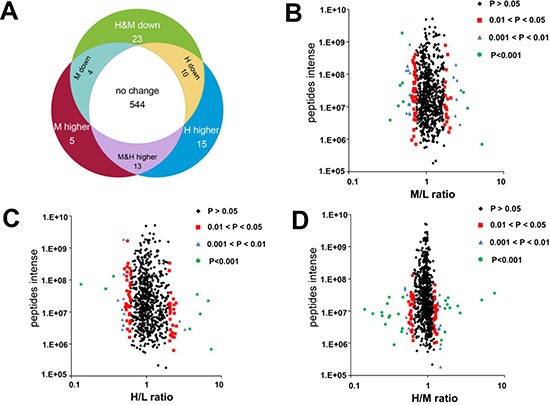
Figure 3. Effect of K-RasG12V activation on mitochondrial proteins expression profiles.

(A) Venn diagrams depict 614 proteins identified and quantified by SILAC and LC-MS. 544 proteins remained unchanged. 70 proteins showed significantly altered expression in cells with K-Ras induction for 24 or 48 hrs compared with control without K-Ras induction (P < 0.05). (B–D) Volcano plots showing protein ratios of each pair of cells indicated. H, K-Ras induction for 48 hrs. M, K-Ras induction for 24 hrs. L, control without K-Ras induction.
