
Figure 2. miR-191 promotes cell viability and proliferation.
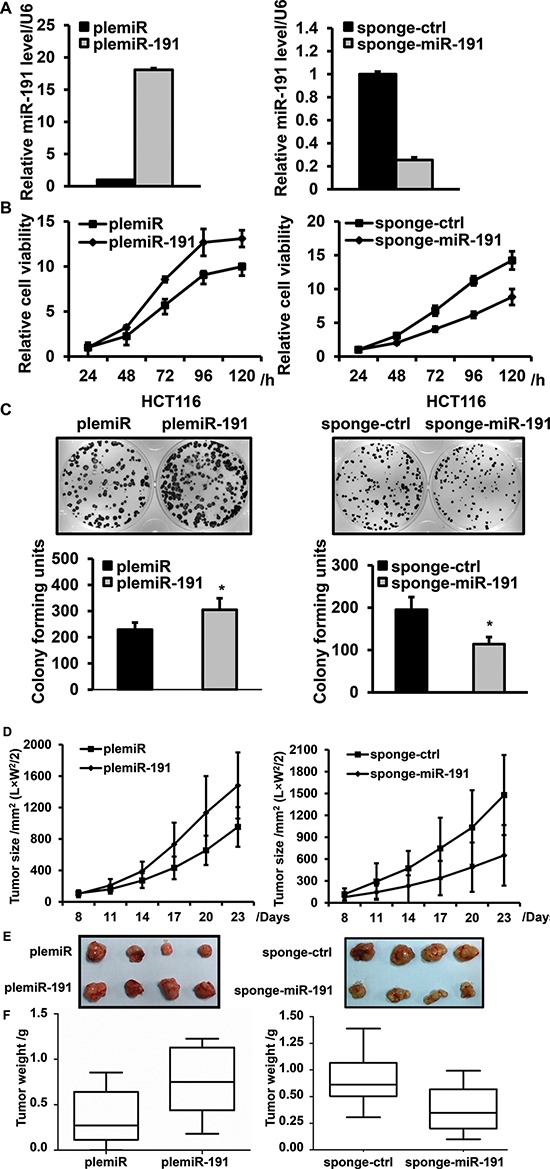
(A) Confirmation of the level of miR-191 in stably transfected HCT116 cell lines by RT-PCR; cells transfected with the empty vector were used as a negative control. (B) The cell viability of HCT116 cells was determined by CCK8 assays after transfection of plemiR-191(left, B) and sponge-miR-191(right, B), at 24, 48, 72 96 and 120 hours. (C) Relative colony formation units of plemiR-191- (left, C) and sponge-miR-191-transfected (right, C) stable HCT116 cells. The lower panels indicate the quantification of the indicated relative colony-forming units (n = 3, *P < 0.05 versus plemiR-ctrl and sponge-ctrl). (D) The tumor volume of plemiR-191-/sponge-miR-191-treated mice 23 days after transplantation. (E) Representative images and (F) tumor weights of the isolated tumors from injected mice (n = 6 – 8). The data represents the means ± SDs.