
Figure 3. Cellular glycolysis rate positively correlates with the extent of global histone acetylation.
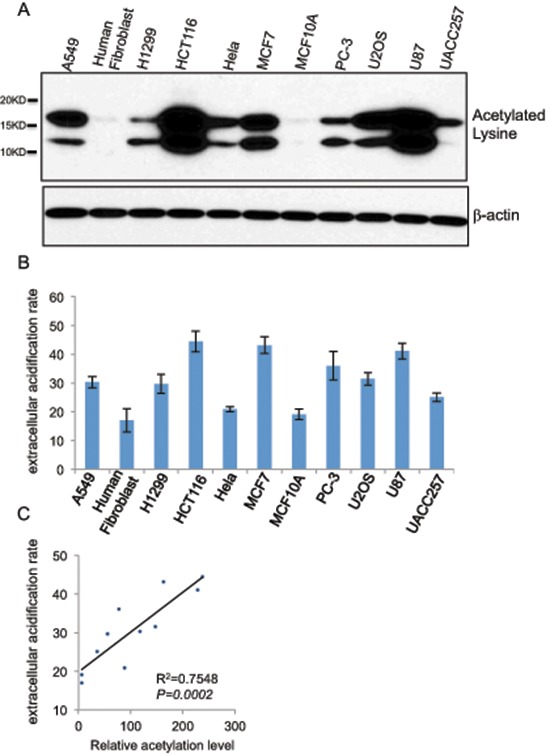
(A) Global histone acetylation levels of 11 different human cell lines (A549, human fibroblast, H1299, HCT116, HeLa, MCF7, MCF10A, PC-3, U2OS, U87, UACC257) were determined by western blot with a lysine acetylation specific antibody with β-actin as a loading control. (B) Glycolytic rates shown as the extracellular acidification rates (ECAR) of 11 cell lines were measured by seahorse XFe Extracellular Flux Analyzers, Data shown are average values of three experiments with error bar indicate mean ± s.d. (C) The correlation between the glycolytic rate and global histone acetylation level in 11 human cells.