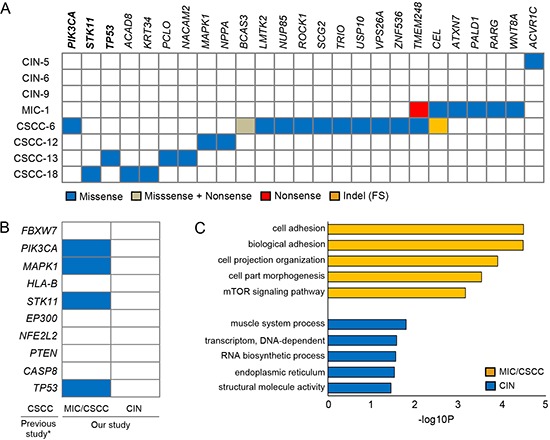
Figure 3. Driver mutations and pathway analyses.

(A) The 25 candidate driver mutations identified by the CHASM analysis with the four functional categories indicated in the inset. PIK3CA, STK11 and TP53 genes (bold) were overlapped with both cancer Gene Census and the cervix top 20 genes in the COSMIC database. (B) Comparison of our candidate drivers with the top ten significant mutations in previous study [8]. Asterisk indicates the Ojesina et al's report [8]. Blue boxes represent the mutations detected in this study. (C) The results of the DAVID pathway analyses. Top five functional clusters are shown for the MIC/CSCC and CIN genomes. X-axis represents the log-transformed P-values.
