
Figure 1. GHSR methylation pattern, average methylation degree and ROC curve analysis in seven common malignancies and respective normal tissue.
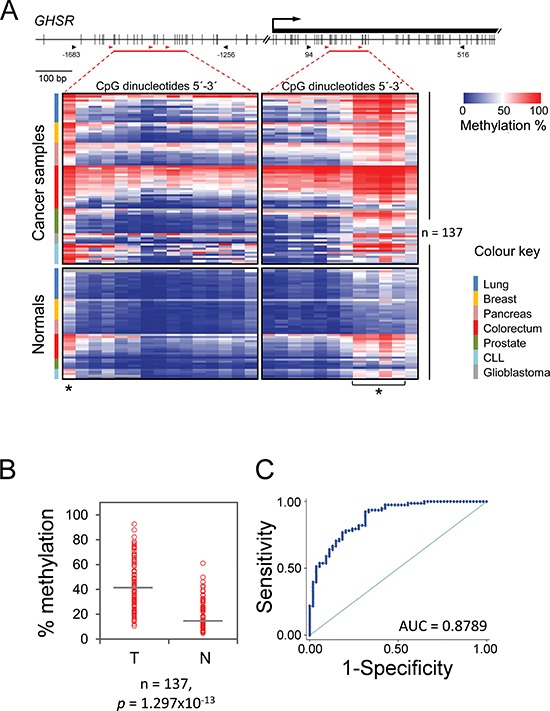
(A) CpG map of the interrogated regions (top). Vertical bars indicate the positions of CpG dinucleotides. The location of the first exon is shown as a black rectangle. The arrow indicates the GHSR transcriptional start site. The black arrowheads indicate the portions of the CpG islands within the gene's promoter and first exon that were PCR amplified (numbering relative to transcriptional start site); the horizontal red bars specify the CpG sites quantified by pyrosequencing; the red arrowheads denote the positions of sequencing primers. GHSR methylation pattern (bottom). Columns of the heatmap represent 27 CpG sites that are highlighted with horizontal red bars in the CpG map above. The degree of methylation was measured by bisulfite pyrosequencing in a total of 137 tissue specimens (shown as rows), which included cancer samples (top) of lung, breast, pancreas, colorectum, prostate, chronic lymphocytic leukaemia and glioblastoma as well as respective control tissue samples (bottom). Samples within each tumor entity are colour coded (legend at the right) and sorted descending by the average methylation degree. Asterisks denote CpG sites that were considered in ROC curve analysis. (B) Average percentage of methylation across 27 CpG sites (vertical axis) is plotted against the sample type (horizontal axis): tumor (T) and non-neoplastic tissue (N). Each circle indicates the methylation degree of a particular specimen. Horizontal bars denote the median methylation level for the cancer samples or the normal controls, respectively. For CLL, B cells of healthy donors were employed as control. P-value (Wilcoxon test) is shown. (C) ROC curve using average GHSR methylation across 27 CpG sites. The value of area under the curve (AUC) is shown.