
Figure 4. GHSR methylation degree, ROC curve analysis and methylation percentages across different stages in a validation set of PDAC and normal pancreas tissue specimens from healthy individuals.
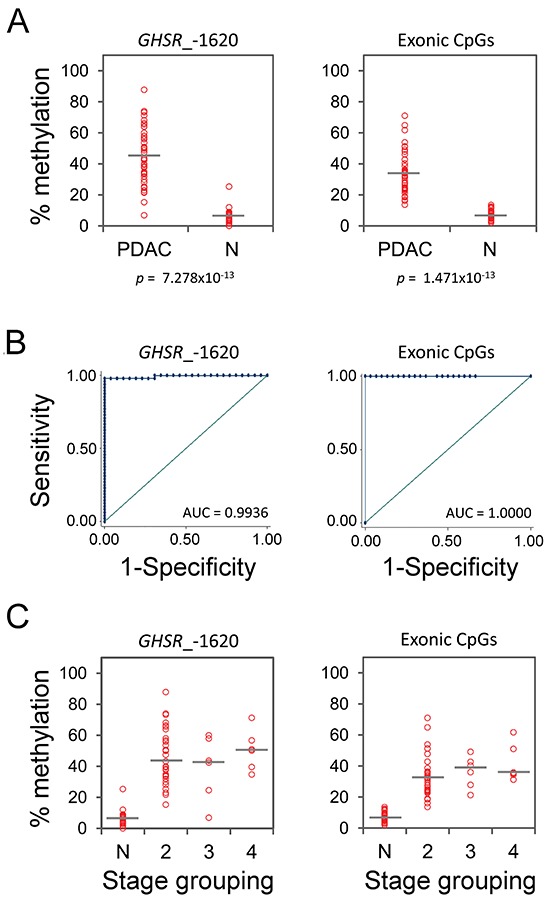
(A) Percentage of methylation at CpG site GHSR_–1620 (left diagram) and average of methylation levels of the four exonic CpGs (right diagram, vertical axis) is plotted against the sample type (horizontal axis): PDAC and normal pancreas tissue (N). Each circle indicates the methylation degree of a particular specimen. Horizontal bars denote the median methylation level for the cancer samples or the normal controls, respectively. P-value (Wilcoxon test) is shown. (B) ROC curves using methylation percentages from (A). The AUC values are shown. (C) Percentages of methylation from (B) (vertical axis) is plotted against tumor stages (horizontal axis). Each circle indicates the methylation degree of a particular tumor specimen. Horizontal bars denote the median methylation level for tumors of each stage. Note the essentially similar GHSR methylation levels at different stages of PDAC progression.