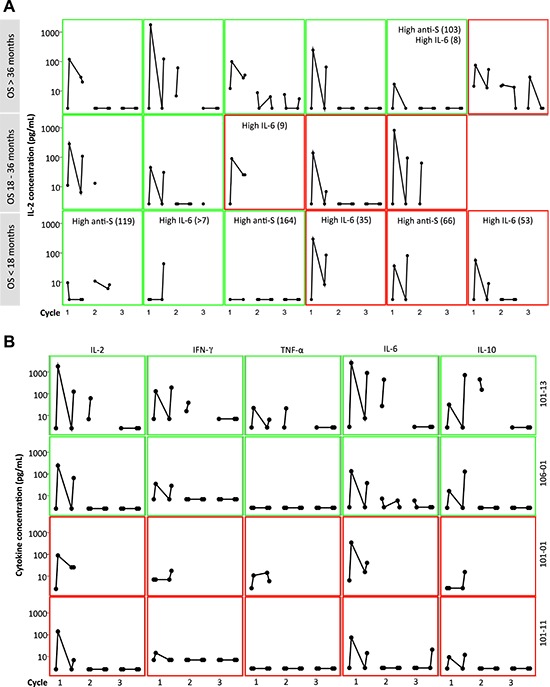
Figure 5. Cytokine response (pg/mL) in plasma at pre-dose and 3 hours after the first and second day of 3 cycles of Nap treatment. Green frame shows Good MSKCC risk score and red frame shows Intermediate MSKCC risk score.

(A): IL-2 response in 17 of 18 patients from the UK. The patients were categorized according to their OS. Patients having over median of baseline anti-SEA/E-120 (High anti-S; > 53.5 pmol/mL) or IL-6 (High IL-6; > 7 pg/mL) are depicted. (B): IL-2, IFN-γ, TNF-α, IL-6 and IL-10 and response in the four patients with the most pronounced Nap-specific T lymphocyte reduction on day 4 and expansion on day 8 (patients 101–01, 101–11, 101–13 and 106–01).
