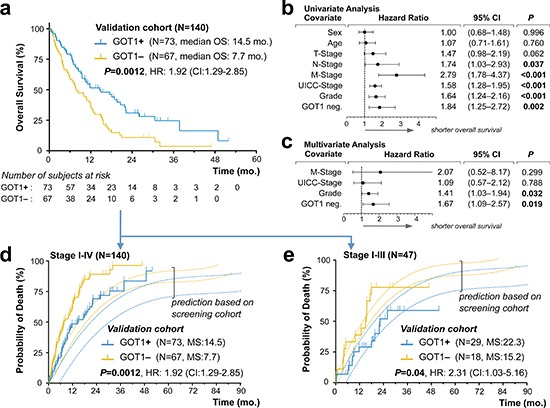
Figure 3. Validation of GOT1 expression status as an independent prognostic biomarker in pancreatic ductal adenocarcinoma.

(a) Kaplan–Meier estimates of outcome for GOT1 positive vs. negative samples in our validation cohort. (b, c). Forest plots of log hazard ratios (HR) from univariate (b) and multivariate (c) Cox proportional regression models for overall survival according to baseline clinical characteristics. Note, for comparison of effect size among characteristics associated with shorter overall survival, we plotted GOT1-negativity (GOT1 neg.). (d, e) Stacked cumulative incidence of death in the validation cohort, plotted over our prediction model that was built based on survival data in our screening cohort (Figure. 2). Note, the shift between validation- and prediction curves (d) is due to the inclusion of 93 patients with biopsy-confirmed metastatic PDAC; curves shift when comparison is restricted to patients in stage I–III(e).
Abbreviations: mo., months; HR, hazard ratio; CI, confidence interval.
