
Figure 1.
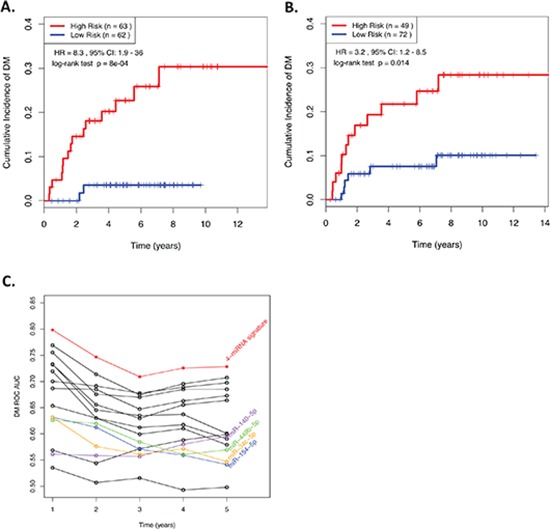
(A&B) Kaplan-Meier curves showing NPC patients dichotomized based on risk score in (A) the training cohort; and (B) the validation cohort. “High Risk” is defined as a RS ≥ the median in the training cohort, and “Low Risk” is defined as a RS < the median in the training cohort. (C) ROC AUCs across various time points demonstrating the ability of prognostic models generated using all possible combinations of 1, 2, 3, or 4 miRNAs from the 4-miRNA signature to predict distant relapse in NPC patients. RS, Risk Score; HR, Hazard Ratio; CI, Confidence Interval; ROC, receiver operating characteristic; AUC, Area Under the Curve.