Figure 2.
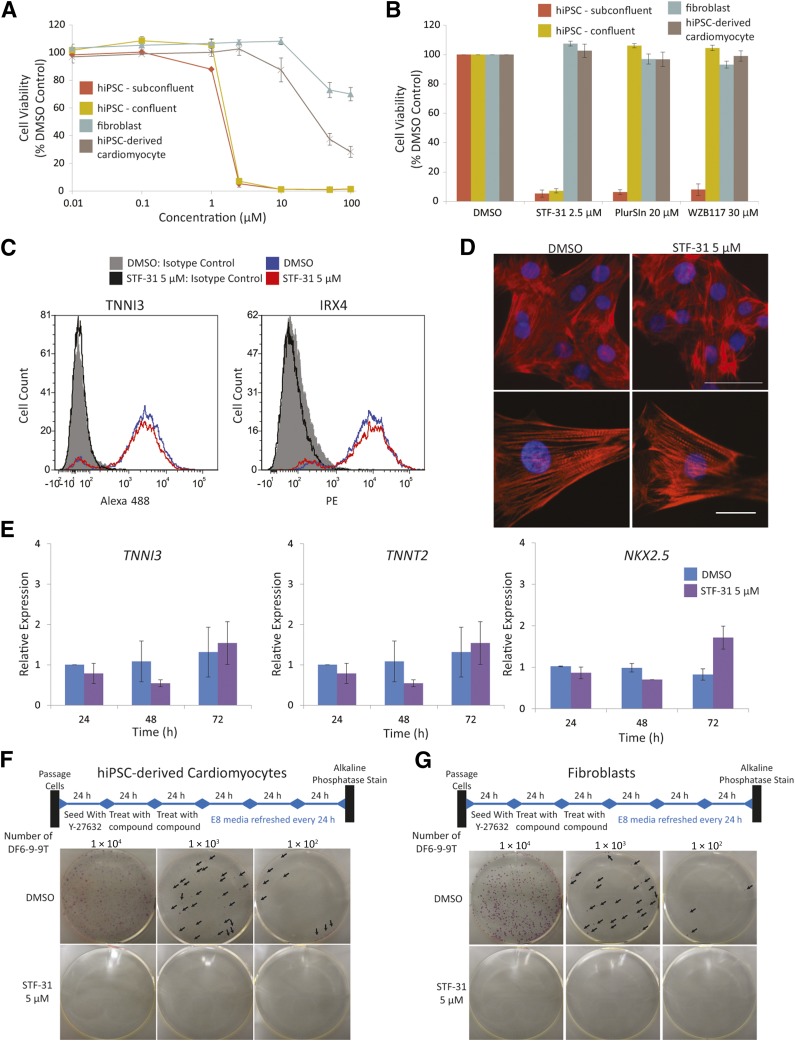
Twenty-four-hour pulse treatment for selective in vitro elimination of hiPSCs. (A, B): Titration (A) and comparison of small molecules (B) with 24 hours of treatment with STF-31 (0.01–100 μM), 30 μM WZB117, and 20 μM PluriSIn in subconfluent and confluent hiPSCs (DF6-9-9T), fibroblasts, and DF6-9-9T hiPSC-derived cardiomyocytes. Average viability was measured with neutral red assay 72 hours after treatment initiation (n = 3). (C): Representative flow cytometry histograms of TNNI3 and IRX4 abundance in hiPSC-derived cardiomyoyctes 72 hours after initiation of a 24 hours treatment with 5 μM STF-31 (n = 3). (D): Representative images for immunofluorescent detection of TNNT2 organization in day 15 hiPSC-derived cardiomyocytes following a 24-hour pulse treatment with 5 μM STF-31 on day 10 of differentiation. Top: cell clusters imaged at ×40. Bottom: individual cells showing structural organization imaged at ×100 magnification. Scale bars in top panel = 50 μm, in bottom panel = 20 μm (n = 3). (E): Bar graphs for qPCR of TNNI3, TNNT2, and NKX2.5 24–72 hours after initiation of a pulse treatment with 5 μM STF-31 in day 10 hiPSC-derived cardiomyocytes. (F, G): Representative images of alkaline phosphatase staining to detect DF6-9-9T hiPSC colonies in cocultures with day 10 hiPSC-derived cardiomyocytes (F) and human fibroblasts (G). DF6-9-9T were plated between 1 × 10² and 1 × 10⁴ live cells and treated for 48 hours with 5 μM STF-31 24 hours after plating (n = 3 for cardiomyocytes and n = 5 for human fibroblasts). Bar graphs representing the average numbers of colonies per well for treatment of DF6-9-9T coculture with fibroblasts are shown in supplemental online Figure 4. Abbreviations: DMSO, dimethyl sulfoxide; h, hours; hiPSC, human induced pluripotent stem cells.

