Figure 4.
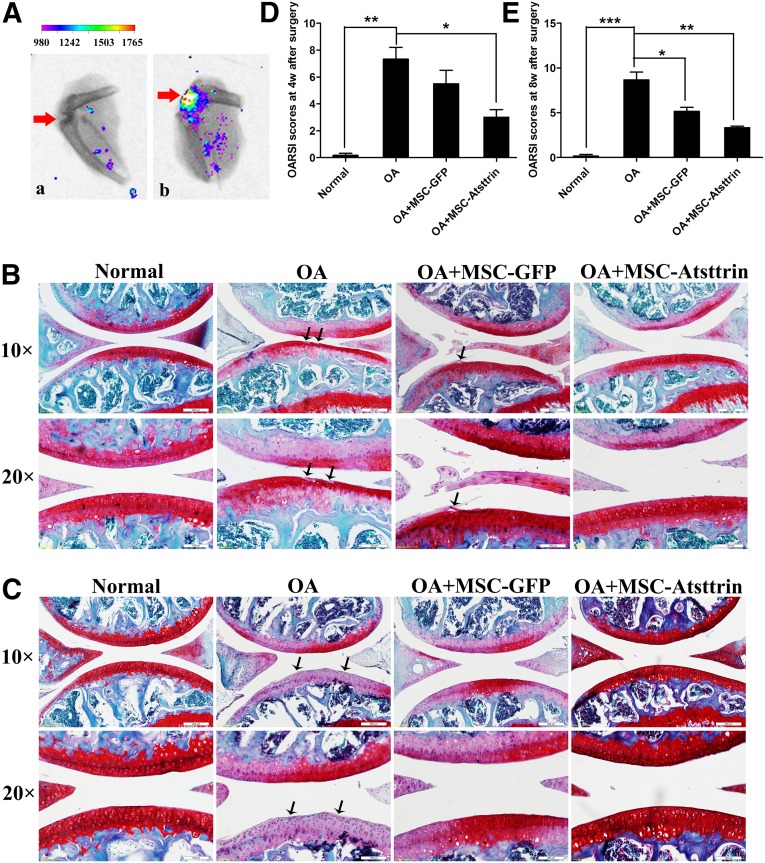
Intra-articular injection of MSC-Atsttrin delayed OA cartilage degradation. (A): Cell tracking displayed positive orange fluorescent signal in the joint 1 week after cell injection by Color CCD. (a) represents the OA group without cell transplantation, and (b) represents the tracking image of OA+MSC-Atsttrin group (the color coding and grades showed the intensity of fluorescent signal). (B, C): Safranin Orange staining of cartilage samples at 4 weeks (B) and 8 weeks (C). Scale bars = 200 or 100 µm. (C): After anterior cruciate ligament transection, with arrows showing the defect area. Scale bars = 200 or 100 µm. (D, E): OARSI scores of samples at 4 (D) and 8 (E) weeks after OA induction. ∗ , p < .05; ∗∗, p < .01; ∗∗∗, p < .001 (n = 6). Abbreviations: GFP, green fluorescent protein; MSC, mesenchymal stem cell; OA, osteoarthritis; OARSI, Osteoarthritis Research Society International.

