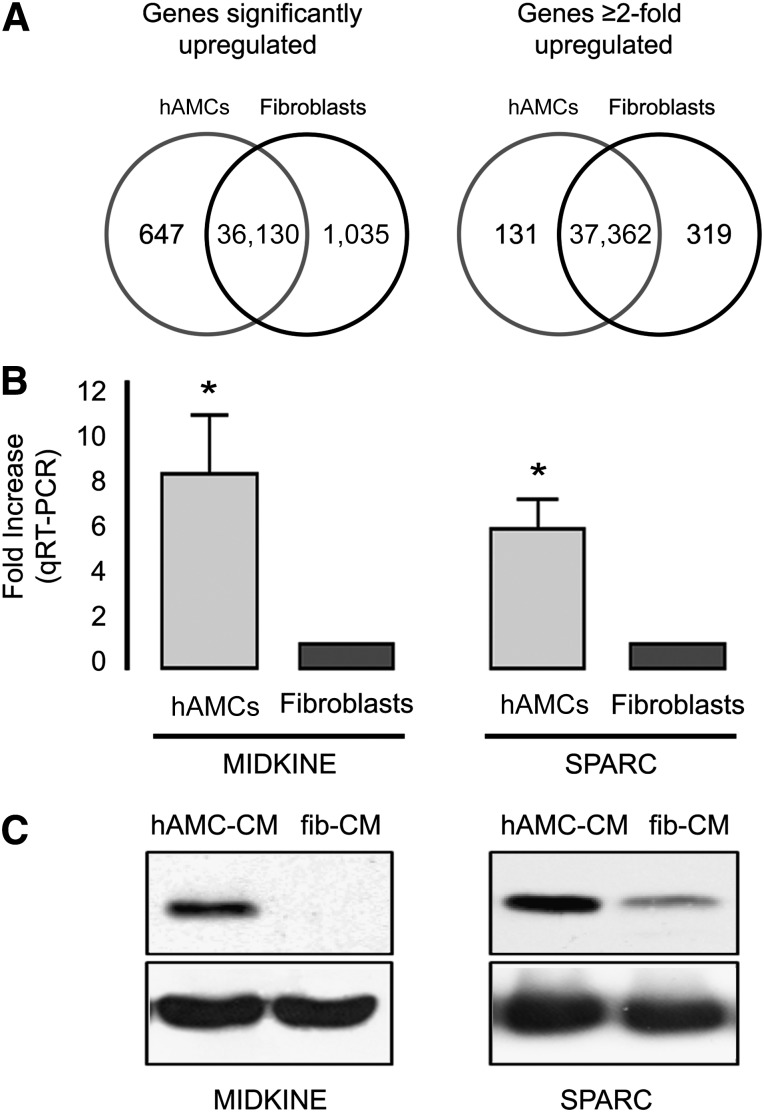
Figure 6.
Identification of paracrine active mediators. (A): Venn diagrams representing the number of detected genes significantly upregulated (left) and upregulated more than twofold (right) in hAMCs and fibroblasts. (B) qRT-PCR validation analysis of MDK and SPARC expression in hAMC and fibroblasts. The bar graph represents the fold increase expression value of hAMC-CM compared with fibroblasts. ∗, p < .001. Data are expressed as the mean ± SD. Data are representative of three independent experiments (two replicates each). (C): Representative Western blot analysis of MDK (14.6 kDa, left) and SPARC (35 kDa, right) in hAMC-CM and fib-CM. Data are representative of three independent experiments. Abbreviations: fib-CM, human dermal fibroblast conditioned medium; hAMCs, human amniotic membrane-derived mesenchymal stromal cells; hAMC-CM, conditioned medium obtained from hAMCs; qRT-PCR, quantitative reverse transcription-polymerase chain reaction; SPARC, secreted protein, acidic, cysteine-rich.

