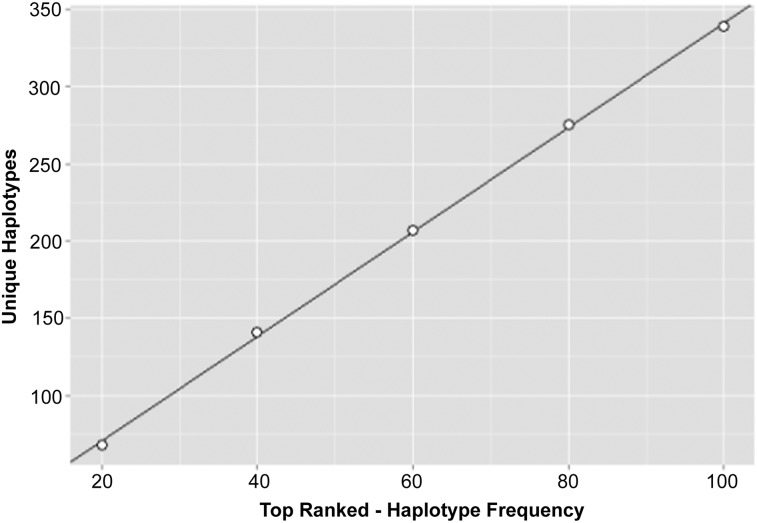
Figure 2.
Unique haplotypes per haplobank. The top 20, 40, 60, 80, or 100 haplotypes ranked by frequency (from largest to smallest) were pulled from each ancestry and combined to form haplobanks. Redundant haplotypes were removed, and the resultant number of unique haplotypes in the haplobank was graphed as a function of the number of haplotypes pulled (points). The line indicates linear regression of the points (slope = 3.4, r2 = .99).

