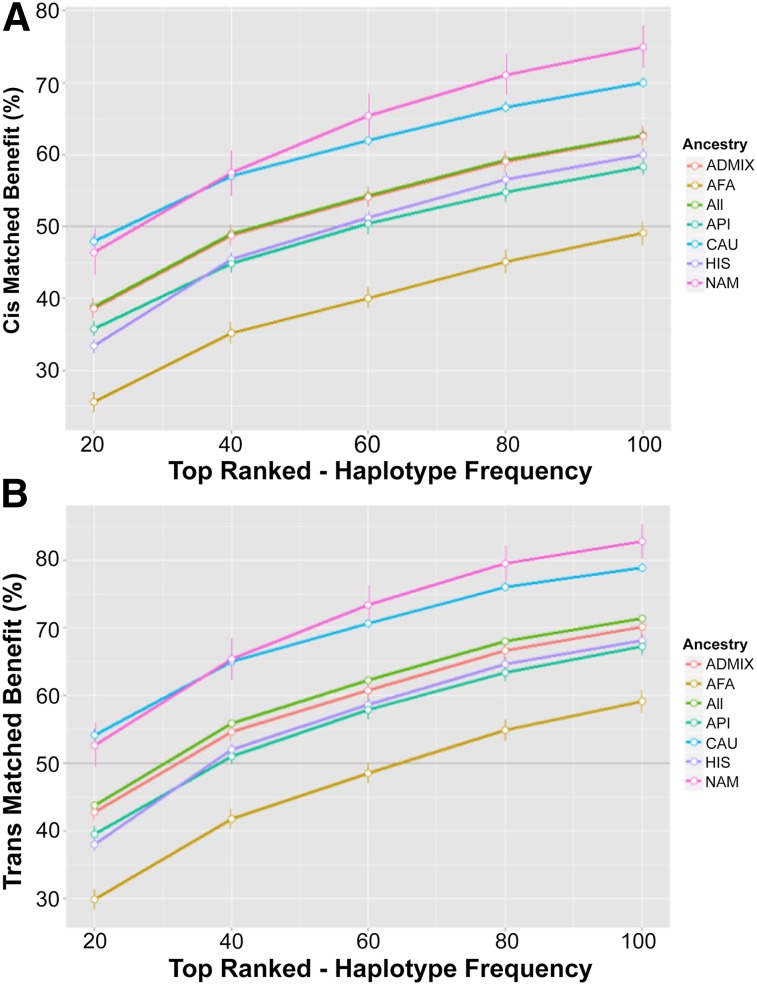
Figure 3.
Per-haplobank benefit. The cis (A) or trans (B) average benefit for each haplobank was plotted against the number of haplotypes pulled for each haplobank. Error bars represent the standard deviation from 100 simulations. Dark gray line highlights 50% benefit. Abbreviations: AFA, black or African American; API, Asian and Pacific Islander; CAU, white (non-Hispanic); HIS, Hispanic; NAM, American Indian and Alaska native.

