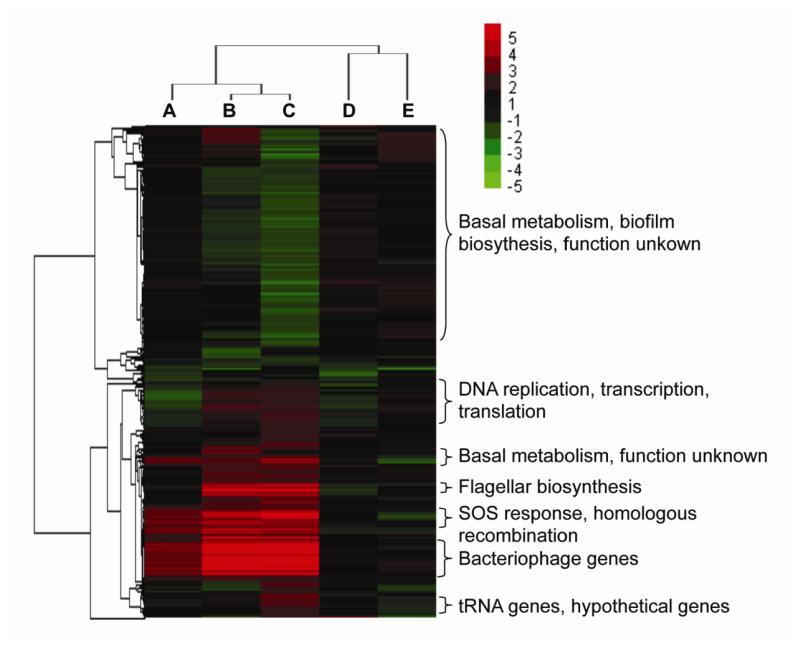
Figure 3.
Hierarchical clustering analysis of microarray data of ΔdptB-E and ΔdptB-H mutants in different growth phases. Clustering was performed on fold-change data for each gene (rows), with green indicating down-regulation and red indicating up-regulation relative to the wild-type strain; the inset shows the color code for the fold-change values. Columns A, B, C represent the ΔdptB-E strain grown at early-exponential, late-exponential and stationary phase, respectively. Columns D and E represent the ΔdptB-H strain at early- and late-exponential phases, respectively.

