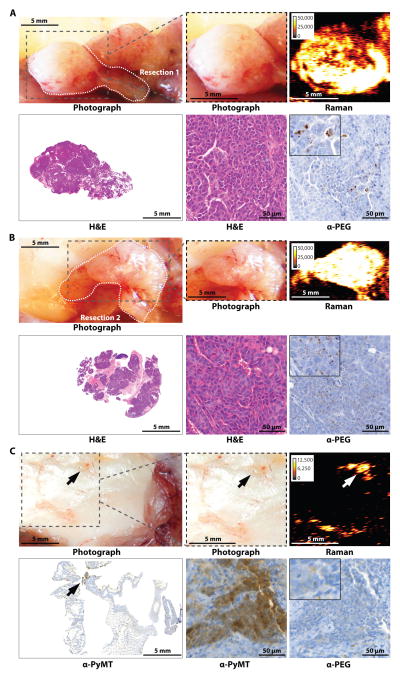
Fig. 2. Imaging of breast cancer in the MMTV-PyMT mouse model.
Images are representative of n = 6 mice. (A and B) Two adjacent tumors developed in the upper and lower right thoracic mammary glands. Gray dashed box in photograph indicates areas scanned with Raman imaging. (A) After imaging, the first tumor was resected along the white dotted line. Anti-PEG IHC staining shows presence of SERRS-nanostars in the tumor. (B) The second tumor was then also resected along the white dotted line. (C) Gray dashed box in photograph indicates resection bed after removal of tumors in (A and B). Staining for PyMT indicated residual microscopic tumor. Raman signal intensity is displayed in counts per second.

