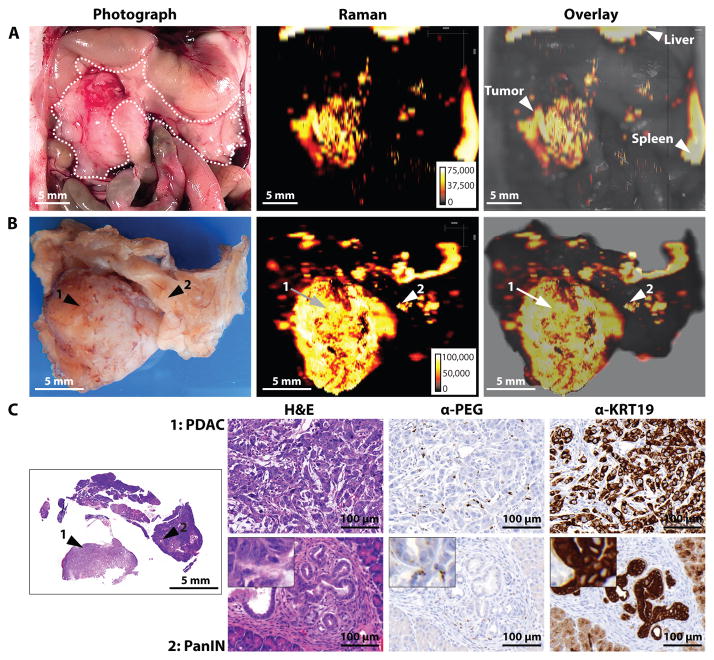
Fig. 5. Imaging of pancreatic ductal adenocarcinoma (PDAC) and pancreatic intraepithelial lesion (PanIN) in the KPC mouse model.
Images are representative of n = 5 mice. (A) In situ photograph of the exposed upper abdomen in a mouse with a PDAC in the head of the pancreas (outlined with white dotted line). Corresponding Raman image, showing SERRS-nanostar signal in the macroscopically visible tumor in the head as well as small scattered foci of SERRS-signal in other normal appearing regions of the pancreas, are also shown. (B) Photographic and high-resolution Raman images of the excised pancreas from (A). (C) H&E staining of the whole pancreas, including PDAC (arrow 1) and PanIN (arrow 2). Histology and KRT19 staining in regions 1 and 2 confirmed lesions. Raman signal intensity is displayed in counts per second.

