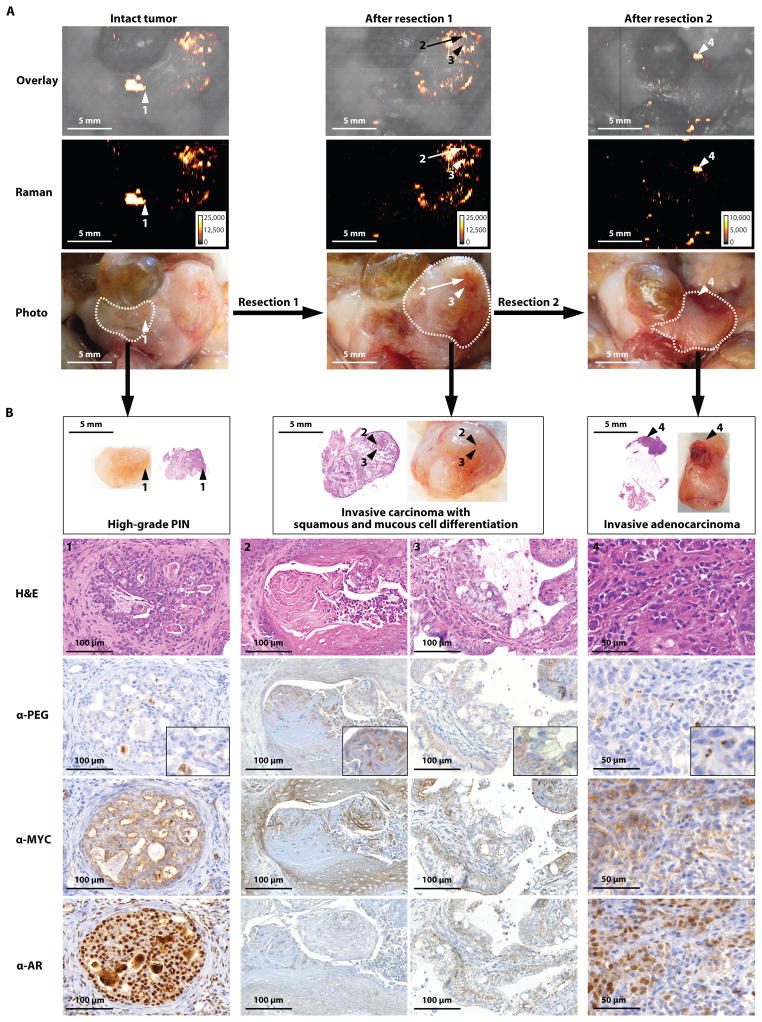
Fig. 6. Imaging different stages and grades of prostatic neoplasia within the same prostate in the Hi-myc mouse model.
Images are representative of n = 5 mice. (A) Sequential resection of the prostatic tumors with correlating Raman images. White dotted lines indicate the margins of each resection. (B) Histological staining for the tumor marker MYC, androgen receptor (AR), and PEG (indicating the presence of SERRS-nanostars) of the respective resected tumors in (A). Raman signal intensity is displayed in counts per second.

