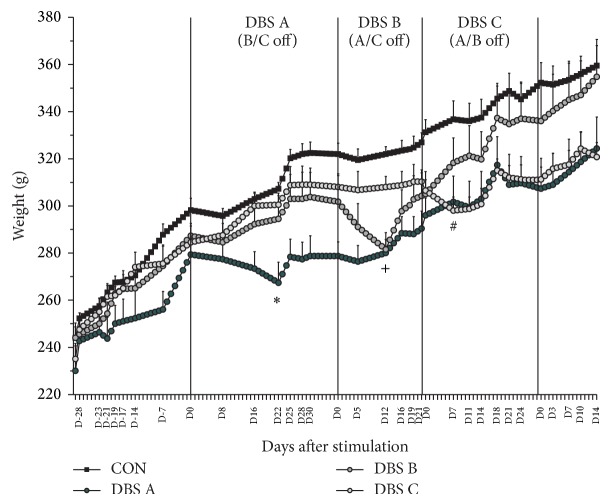
Figure 2.
Weight dynamics. The animals' weight was closely monitored throughout the study and interpreted as a reflection of their health and vigor. The onset of continuous stimulation resulted in a temporary reduction by about 4–6% of the animals' weight compared to the prestimulation value. However, the number of days to reach the lowest and to recover to prestimulation weight, with the ongoing stimulation, differed across DBS A, B, and C. The figure shows the mean weight ± S.E.M. on the days when measurement was taken (labelled on the x-axis). The other values are estimates to show the evolution of the weight. See text for more details. ∗ P < 0.05 DBS A compared to all other groups; + P < 0.05 DBS B compared to C and controls; # P < 0.05 DBS C compared to controls.

