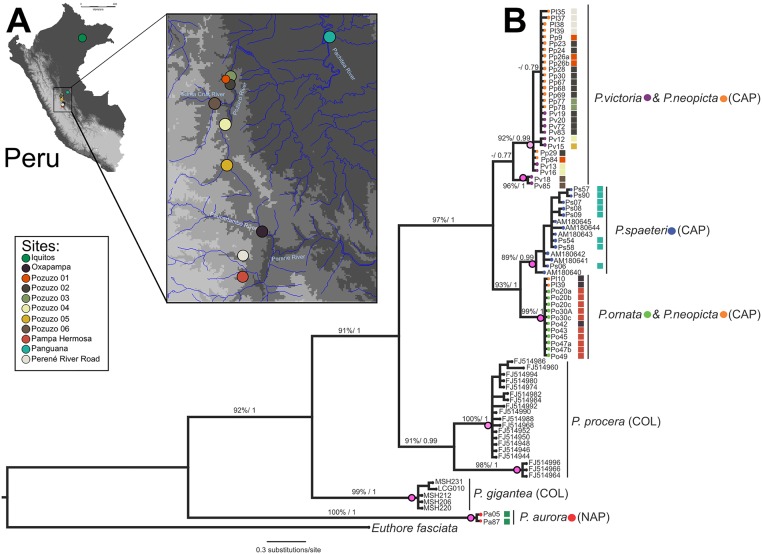
Fig 2. Collection localities of Polythore used in this study and phylogenetic reconstruction using Cytochrome oxidase I (COI).
(A) map of collection localities of and (B) phylogenetic reconstruction (best ML phylogram) using COI data, values above the branches represent bootstraps support (ML) and posterior probabilities (BI). The magenta dots on the nodes represent the OTUs or species boundaries estimated by the PTP species delimitation model; lighter color represents less-supported probability for that OTU.

