
Figure 2.
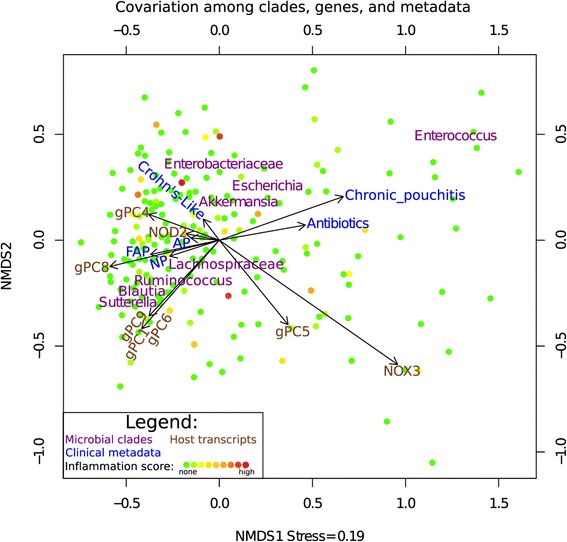
Biplot of clades, genes, and study metadata. Non-metric multidimensional scaling (NMDS) of clade abundances was used to position samples and show samples relatively enriched in specific clades (purple). Arrows represent host transcripts (brown) and metadata (blue), which include antibiotic use and clinical outcome. Arrow coordinates are determined by averaging the coordinates of each sample containing a specific metadata, and show the central tendency of the metadata. Samples are color-coded according to inflammation, which ranges from none (green) to high (red). This figure was created with PPI-only samples.