
Figure 4.
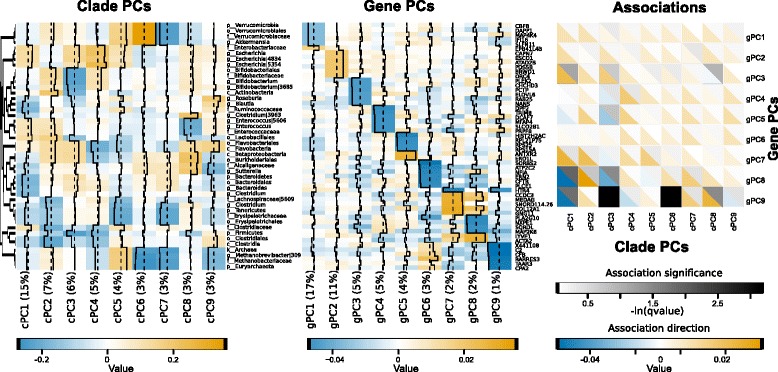
Results of multivariate linear modeling. Principal component analysis was used to reduce the data into nine gPCs and cPCs that explained 50% of total transcriptional and microbial variation. The top six loadings for each cPC (left) and cPC (middle) are shown; orange and blue indicate increases or decreases in expression, respectively. (Right) MaAsLin [5,28] was used for multivariate linear analysis of associations between cPCs and gPCs while controlling for the effects of inflammation, tissue location, and antibiotic use. Black/gray scale corresponds to the significance of the association, while blue / orange corresponds to the direction. See also Additional file 5.