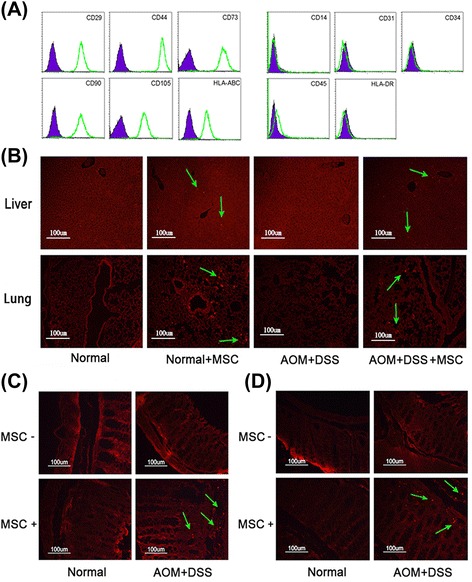
Figure 1.

The phenotype and migration pathway of MSCs in the DSS/AOM-induced model. (A) Expression of MSC phenotype was detected by FACScalibur flow cytometer. (B) Liver and lung in each group were moved, collected and paraffin sections made at day 6 to detect the migration pathway of MSCs stained with CM-DiI (red). (C) and (D) show colon tissue collected to detect the migration pathway of MSCs at day 6 and day 10. AOM, azomethane; DSS, dextran sulfate sodium; FACS, fluorescence activated cell sorting; MSCs, mesenchymal stem cells.
