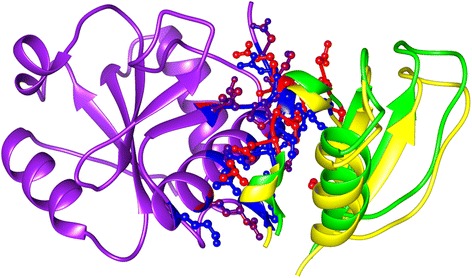
Figure 4.

Interface analysis of a CAPRI target. For 1SYX, one of the chains is superposed for native and the pose ranked next to native. In yellow is the second protein chain from the native complex and blue represents the second chain of the pose ranked second. The interfaces were very similar in both the poses (Interface residues are represented as ball and sticks. In blue are the interface residues from the native complex and red are the interface residues from the second pose).
