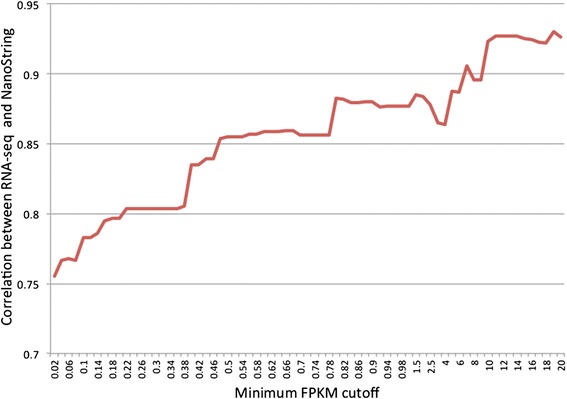
Figure 2.

The correlation of log2 fold-change between RNA-seq and NanoString increased with gene expression levels. Pearson’s correlation of log2 fold-changes, i.e. “log2 ratio (high-FE/low-FE)”, between RNA-seq and NanoString is computed for different sets of target genes that are selected based on RNA-seq gene expression levels (FPKM value). X-axis represents the minimum FPKM cutoff used for gene filtering. Y-axis represents the Pearson’s correlation of log2 fold-change between RNA-seq and Nanostring.
