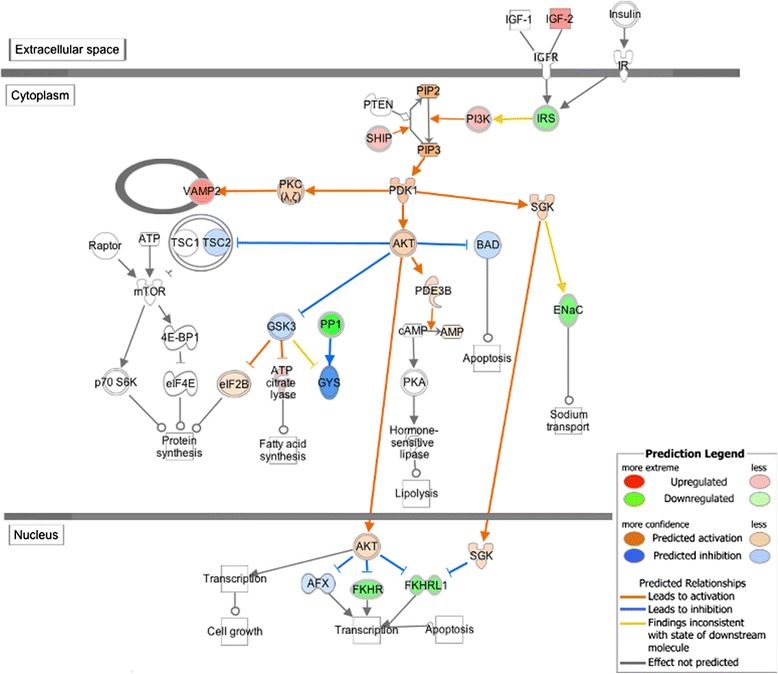
Figure 5.

IGFs/PI3K/Akt signaling pathway analysis using Ingenuity Molecule Activity Predictor (MAP). MAP predicts the upstream and downstream effects of the mapped genes on IGFs/PI3K/Akt signaling pathway and hypothesizes the overall states of this pathway. Red and green symbols indicate genes up- and down-regulated in high-FE chickens, respectively. Orange and blue nodes indicate genes predicted to be activated or inhibited in the high-FE chickens, respectively. The color intensity is proportional to the degree of fold change. Edges between the nodes are colored orange when leading to the activation of downstream genes, blue when inhibiting downstream genes. Yellow edges indicate that the states of downstream genes are inconsistent with the prediction based on previous findings.
