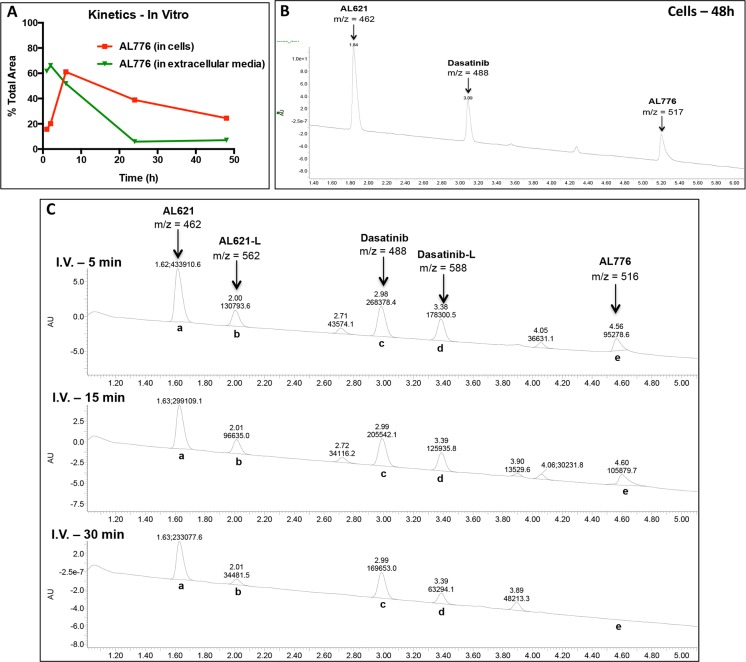
Fig 4. In vitro and in vivo hydrolysis of AL776 using high performance liquid chromatography (HPLC) and mass spectrometry (MS) analyses.
(A) The kinetics of entry into the cells and degradation of AL776 inside the cells were monitored using HPLC analysis. NIH3T3-Her14 (EGFR transfected) cells were treated with 25 μM of AL776 for 1h, 2h, 6h, 24h and 48h, after which the cells and the corresponding extracellular media were collected and processed according to the procedure described in the Materials and Method section. The area under the curve (AUC) for the AL776 peak was determined and its percentage compared with all the other peaks was calculated and plotted. (B) A representative spectrum obtained from liquid chromatography (LC)-mass spectrometry (MS) analysis in cells treated with AL776 for 48h is shown with m/z = 462 (AL621), m/z = 488 (dasatinib) and m/2z = 517 (AL776). (C) The kinetics of AL776 hydrolysis in the plasma of CD-1 mice injected with 80 mg/kg of the drug was monitored 5, 15 and 30 min post-administration. LC-MS chromatograms at different time points with m/z values for intact AL776 and its metabolites are shown: m/z = 462 for AL621, m/z = 562 for AL621-L (succinic acid linked-AL621), m/z = 488 for dasatinib, m/z = 588 for dasatinib-L (succinic acid linked-dasatinib), m/2z = 516 for AL776.

