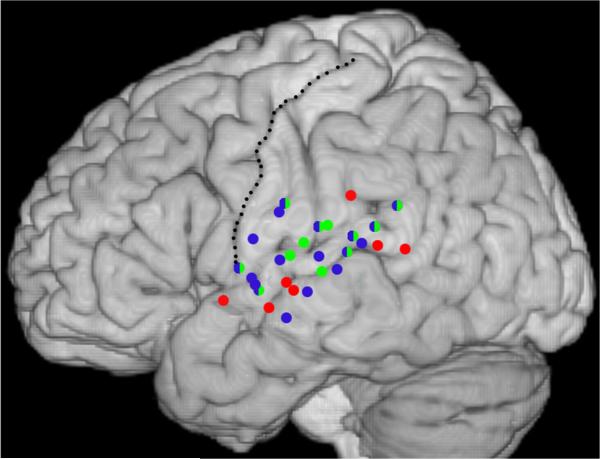
Fig. 1.
Composite data from the three participants. Electrode locations that showed significant MMN responses are projected onto the MNI template brain. Red circles indicate electrodes classified as most responsive to speech, blue circles electrodes classified as responsive to complex stimulation, and green circles electrodes classified as most responsive to tones. Double classifications are indicated by bi-colored circles. The central sulcus is delineated with a stippled line

