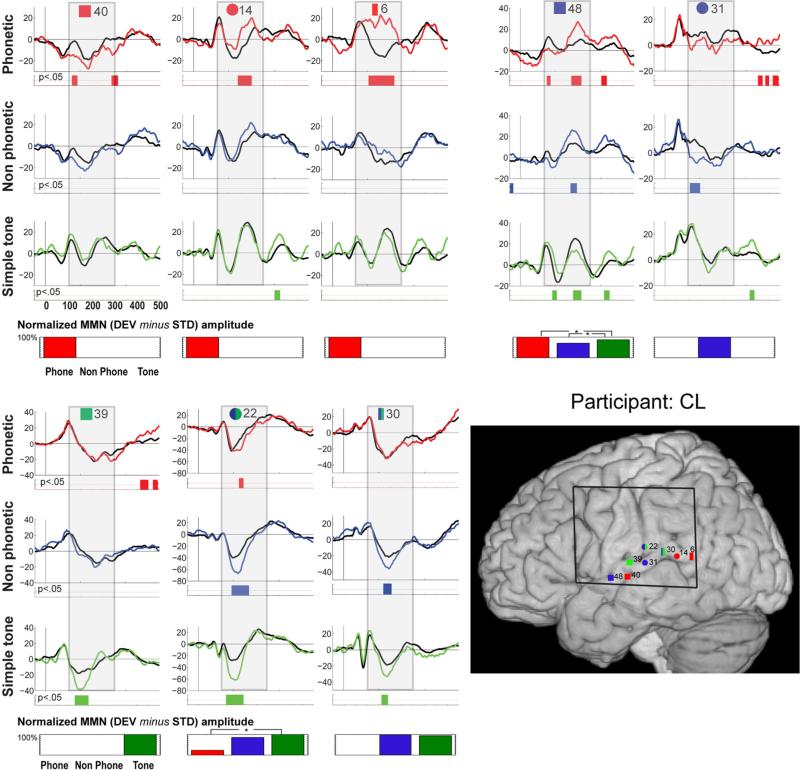
Fig. 4.
Individual data for participant CL. Evoked responses to the standard (black trace) and deviant (colored trace) stimuli are shown for electrodes that exhibited significant MMN responses. Periods of significant difference are indicated by the color strip below the waveforms. The period of 100–300 ms post-stimulus onset is highlighted by a gray box. In the lower right corner, electrode positions are illustrated on the MNI template brain. Electrodes are shape and number coded to link the specific waveform data with the location. Color coding indicates the designation of the channel: red shapes indicate electrodes where the MMN was greatest in response to speech stimulation; blue shapes electrodes most responsive to complex stimulation; and green shapes electrodes most responsive to simple tones. Double classifications are indicated by bi-colored shapes. The black square on the brain shows the borders of the electrode grid. Below each column of waveform responses, a bar graph quantifies stimulus-specific MMN responses for each electrode site, by showing the integrated amplitude of the statistically significant effect (to therefore represent both its amplitude and duration), within the 100–300 ms post-stimulus onset window that was considered in our analyses. Values are scaled with respect to the largest at a given contact (which is set at 100 %).Statistical differences between MMNs to the different stimulus types are indicated by asterisks

