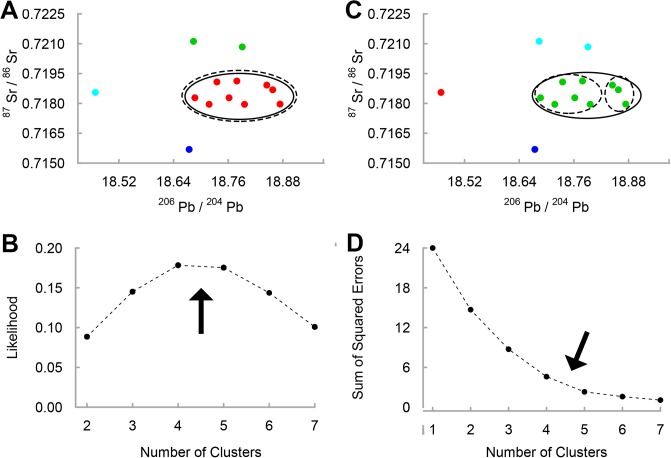
Fig 2. Local dietary catchment at Harappa inferred through cluster analysis of faunal isotope ratios.
The structures of the optimal clustering solutions are depicted in Pb-Sr space (206Pb/204Pb vs. 87Sr/86Sr) with each cluster assigned a different color. Solid circles identify the local faunal cluster determined by the four-cluster solutions, dashed circles identity the local faunal cluster determined by the five-cluster solutions. The (A) optimal DBSCAN clustering solution in Pb-Sr space is inferred from (B) a likelihood estimation of all non-trivial DBSCAN clustering solutions. The (C) optimal K-means clustering solution is inferred from (D) the “elbow” in the K-means SSE plot.

