
Figure 2.
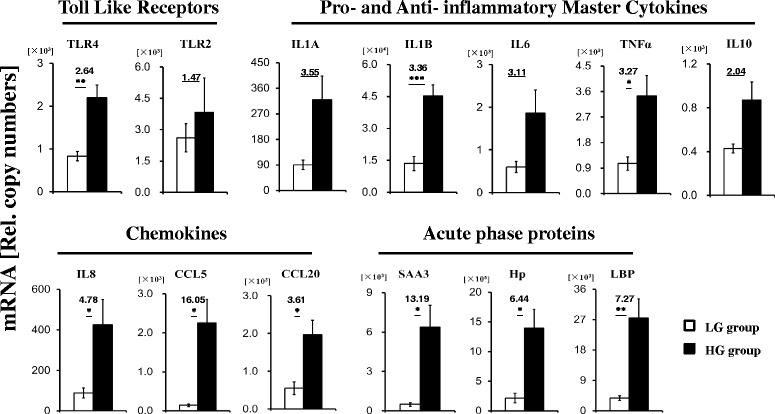
Quantification of the immune gene expression by RT-qPCR. Ordinate axis indicate relative copy number (n = 6 in each group, Mean ± SEM). White filled bar: LG group; black filled bar: HG group. Fold changes and significance (*P < 0.05, **P < 0.01, ***P < 0.001) of the selected genes between LG group and HG group are indicated.