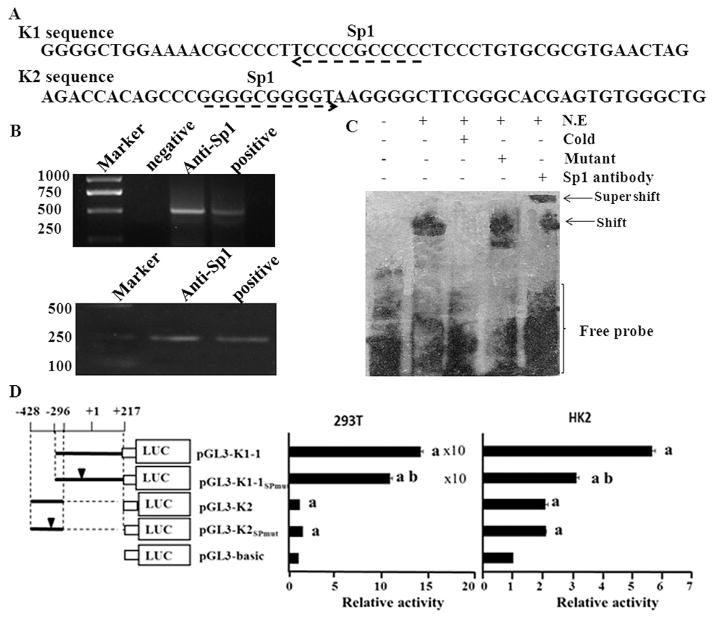
Fig. 5.
Analysis of the transcription factors that could bind to hnRNP K promoter. A. In silico analysis showed that at least two Sp1 binding sites in hnRNP K promoter. B. ChIP analysis verified the binding of Sp1 with hnRNP K promoter in the 293T cells. There were two controls, a non-DNA negative control and an input DNA sample. PCR was performed using primers recognizing the K1 and K2 sequences in the hnRNP K promoter and the amplified products were separated in agarose gel and visualized with EB. The sizes of the PCR products were 513 bp (K1) and 229 bp (K2). Similar results were observed in three independent experiments. C. EMSA confirmed the exact binding site of Sp1 in the 37 bp probe. N.E. denotes nuclear extract of 293T cells. Cold means cold competitor and mutant means mutant competitor. D. Promoter luciferase reporter analysis of the sequences with mutant Sp1 binding sites in 293T and HK2 cells. Values represent the mean ± SD of three independent experiments. T-test was used for statistical analysis. (a) P < 0.05 versus pGL3-basic; (b) P < 0.05 versus pGL3-K1–1.

