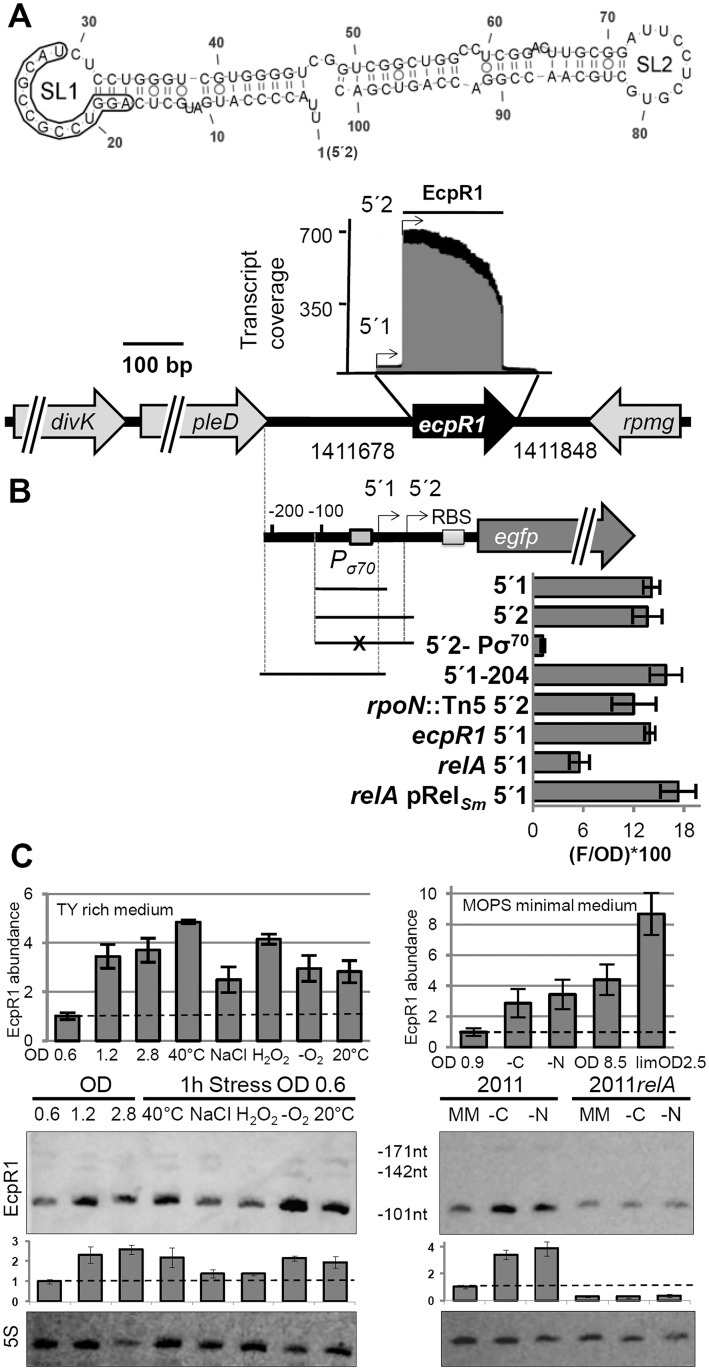
Fig 1. ecpR1 genomic locus and transcriptional regulation.
(A) Secondary structure of the dominant EcpR1 101 nt variant with a minimum free energy of -50.20 kcal/mol. Nucleotide positions relative to the second 5’-end are denoted. SL, stem loop domain. The 13 nt region predicted to bind the gcrA mRNA is boxed. Below, chromosomal region including the ecpR1 gene and RNAseq coverage profile of the EcpR1 sRNA in S. meliloti Rm1021. Genome coordinates of the full length ecpR1 variant are denoted. Black and grey areas represent coverages from samples enriched for processed and primary transcripts, respectively [21]. Detected EcpR1 5’-ends are depicted by arrows and the dominant 101 nt EcpR1 variant used for structure prediction is marked by the bar. (B) Schematic representation of the fragments included in the ecpR1 transcriptional fusions and fluorescence values of stationary phase Rm2011 wild type and derivative cells harbouring the indicated constructs: 5’1, pPecpR1_5’1; 5’2, pPecpR1_5’2; 5’2-Pσ70, pPecpR1_5’2-Pσ70; 5’1–204, pPecpR1_5’1–204. Specific activities were normalized to OD600 to yield fluorescence units per unit of optical density (F/OD). Shown are means and standard deviation values of at least three independent measurements of three transconjugants grown in six independent cultures. (C) qRT-PCR analysis and Northern blot detection of EcpR1 transcript abundance in Rm2011 and the relA mutant under different growth and stress conditions in TY (left) and MOPS minimal and MOPSlim medium (MM, right). 40°C, heat stress; NaCl, 0.4 mM sodium chloride (osmotic stress); H2O2, 10mM hydrogen peroxide (oxidative stress); -O2, microoxic conditions; 20°C, cold stress; -C and -N, growth in MM until OD600 of 0.9 and then MM depleted for 1 hour for carbon or nitrogen. qRT-PCR values were normalized to the SMc01852 transcript and the levels of EcpR1 in Rm2011 growing in TY rich medium at OD600 of 0.6 (left) or MOPS minimal medium at OD600 of 0.9 (right, dashed line). Plots underneath the Northern blots represent relative hybridization signal intensities. The basal level of EcpR1 in Rm2011 growing in TY rich medium at OD600 of 0.6 or MOPS minimal medium at OD600 of 0.9 (right) has been normalized to 1 (dashed line) and the sRNA levels in other conditions have been correlated to this value. Mean results from three experiments are shown. Error bars indicate the standard deviation. Exposure times were optimized for each panel.

