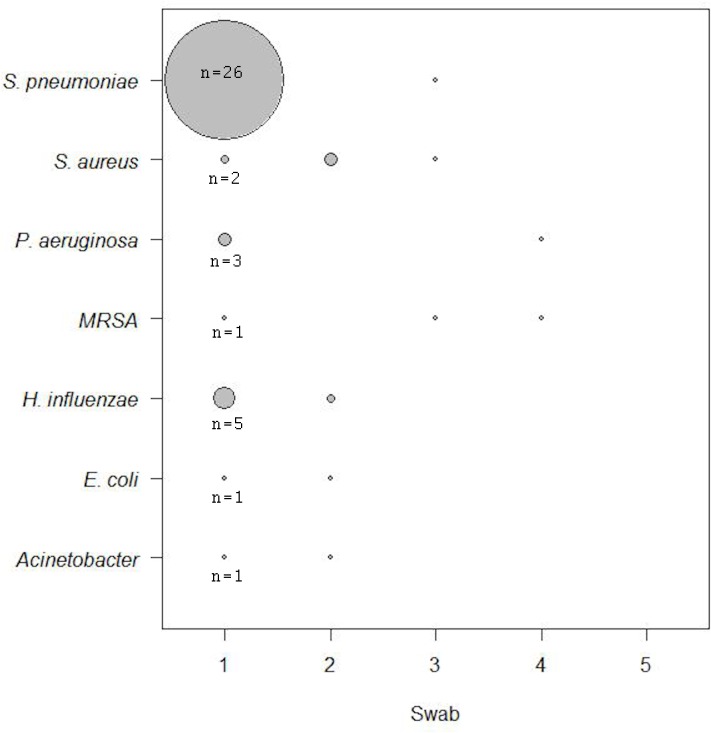
Fig 2. Diagrammatic representation of the time-point during admission that each organism was first detected (when an organism was detected twice or more, i.e. colonisation).
Note that these data are not cumulative, because some organisms might have been detected on the first sample, not on the second and then been detected again on the third sample. The shaded area of each circle represents the number of patients in whom colonisation with that organism was detected at that time-point. The vast majority of these organisms were first acquired on sample 1 or 2 (i.e. during the initial 3 days in hospital), and not later in the hospital stay.

