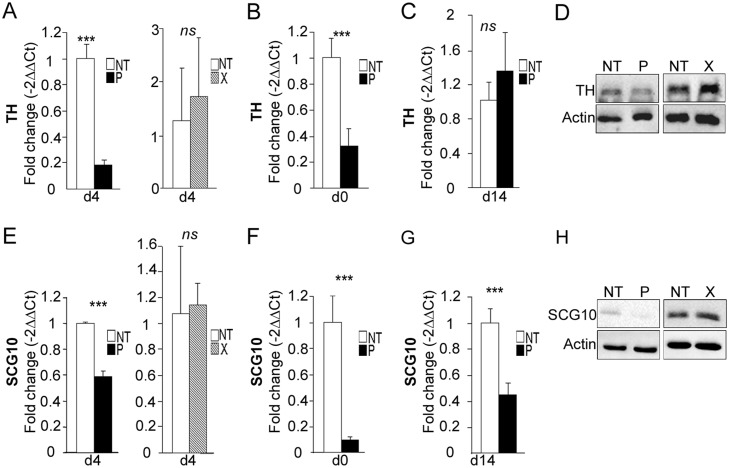
Fig 8. bdv-p alters the expression of TH and Scg10/Stathmin2.
bdv-p- and bdv-x-expressing- hNPCs and their matched NT controls were induced to differentiate for 0, 4 or 14 days before RNA and protein analyses. TH expression was measured by RT-qPCR at (A) day 4, (B) day 0 and (C) day 14. (D) Western blot analysis showing TH level. Scg10/Stathmin2 expression was measured by RT-qPCR at (E) day 4, (F) day 0 and (G) day 14. (H) Western blot analysis showing SCG10/Stathmin2 level. TH and SCG10/Stathmin2 were normalized to actin. The results are representative of 2 independent experiments performed in triplicate. Statistical analyses were performed using the Mann-Whitney test. ***, p < 0.001.

