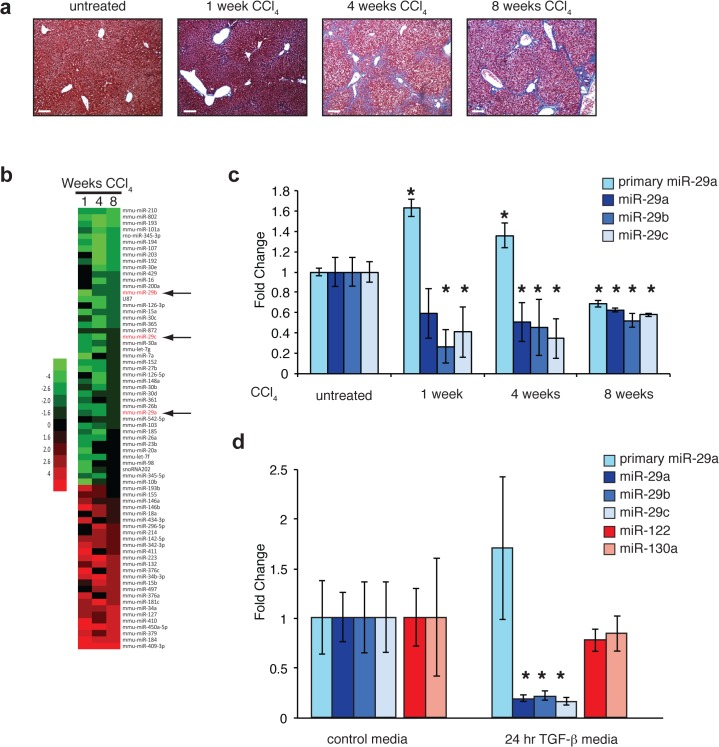
Fig 1. Primary and mature miR-29 expression levels in murine liver and isolated human hepatocytes.
(a) Carbon tetrachloride-mediated liver fibrosis. Trichrome-stained liver sections demonstrating progressive fibrosis during 8 weeks of CCl4 exposure. Scale bar = 100μm (b) Heat map of miRNA expression levels after 1, 4, and 8 weeks of CCl4 exposure (compared to normal liver). The top 70 miRNAs with the largest average fold change are shown and sorted by fold change at 8 weeks. miR-29 family members indicated with arrows. (c) Hepatic expression levels of primary and mature miR-29a,b,c in CCl4-treated mice. Average fold changes for 1 week (n = 4), 4 week (n = 3) and 8 week (n = 2) treatment groups were calculated using normal liver (no CCl4) as a reference (n = 3). Error bars represent +/- one standard deviation. (* = p<0.05 compared to normal liver). (d) TGF-β represses miR-29 expression in human hepatocytes. Average fold change of primary and mature miR-29a/b/c as well as miR-122 and miR-130a in TGF-β treated hepatocytes were calculated using control media-treated cells as a reference. Error bars represent +/- one standard deviation. (* = p<0.05 compared to control media).

