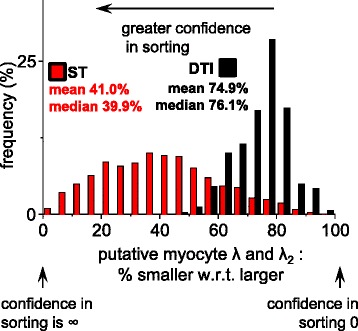
Figure 12.

Exploration of the relative magnitudes of the putative myocyte orientation eigenvalues in the lateral ROI. In order to assess for DTI and for ST whether meaningful sorting of the putative myocyte eigenvector from the intermediate-eigenvector is possible the magnitudes of the putative myocyte orientation eigenvalue was compared to the λ2 (i.e. for ST λ3 was compared to λ2 and for DTI λ1, was compared to λ2). In each case the smaller eigenvalue was expressed as a percentage of the larger eigenvalue. 100% indicates identity and that there is no confidence in sorting the putative myocyte orientation from the intermediate-eigenvector orientation, and approaching 0% the confidence in sorting is high. DTI: Scan #2, 12-direction, b = 1000 s/mm2; ST: Scan #8, DTW = 3, STW = 3. Data in this figure is from the lateral ROI which was visualized and compared to FI laminar orientations in Figures 3 and 7. FLASH: fast low angle shot; ST: structure tensor of FLASH data; DTI: diffusion tensor magnetic resonance imaging; DTW: derivative template width STW: smoothing template width; ROI: region(s) of interest. The symbols for vectors and derived angles are defined in Table 2.
